Abstract:
With the advancements in high-throughput sequencing technologies such as Illumina, PacBio, and 10X Genomics platforms, and gas/liquid chromatography-mass spectrometry, large volumes of biological data in multiple formats can now be obtained through multi-omics analysis. Bioinformatics is constantly evolving and seeking breakthroughs to solve multi-omics problems, however it is challenging for most experimental biologists to analyze data using command-line interfaces, coding, and scripting. Based on experience with multi-omics, we have developed OmicsSuite, a desktop suite that comprehensively integrates statistics and multi-omics analysis and visualization. The suite has 175 sub-applications in 12 categories, including Sequence, Statistics, Algorithm, Genomics, Transcriptomics, Enrichment, Proteomics, Metabolomics, Clinical, Microorganism, Single Cell, and Table Operation. We created the user interface with Sequence View, Table View, and intelligent components based on JavaFX and the popular Shiny framework. The multi-omics analysis functions were developed based on BioJava and 300+ packages provided by the R CRAN and Bioconductor communities, and it encompasses over 3,000 adjustable parameter interfaces. OmicsSuite can directly read multi-omics raw data in FastA, FastQ, MAF, mzML, Matrix, and HDF5 formats, and the programs emphasize data transfer directions and pipeline analysis functions. OmicsSuite can produce pre-publication images and tables, allowing users to focus on biological aspects. OmicsSuite offers multi-omics step-by-step workflows that can be easily applied to horticultural plant breeding and molecular mechanism studies in plants. It enables researchers to freely explore the molecular information contained in multi-omics big data (Source: https://github.com/OmicsSuite/, Website: https://omicssuite.github.io, v1.3.9).
Brief Introduction:
Over the past decade, the widespread application of next-generation sequencing (NGS) technologies represented by Illumina Solexa and HiSeq platforms1, as well as third-generation sequencing (TGS) technologies led by PacBio Sequel2 and Oxford Nanopore3 platforms, has revolutionized the fields of molecular, evolutionary, and computational biology. Currently, omics diversity and integrated multi-omics analysis are thriving research fields, and multidimensional analysis of biological features and mechanisms has become more precise and efficient4. With the widespread application of sequencing and mass spectrometry technologies, the quantity and storage types of data generated are also rapidly increasing5. For example, data generated by PacBio HiFi sequencing has longer reads and higher throughput, and storage formats based on GC/LC-MS (Gas/Liquid Chromatography Mass Spectrometry) such as mzXML (mass spectrometric data in eXtensible Markup Language), mzData (mass spectrometric Data), and mzML6 are gradually evolving to meet more diverse needs. At the same time, data from 10X Genomics7, ranging from Chromium matrix data generated from single-cell transcriptomics to Visium HDF5 (Hierarchical Data Format version 5) data generated from spatial transcriptomics, have become more complex and mysterious. As a result, there are significant differences in the analytical pipelines, methods, and programs employed in data parsing for downstream bioinformatic analysis across genomics, transcriptomics, proteomics, metabolomics, microbial omics, and single-cell omics8.
Main Results:
OmicsSuite native framework architecture
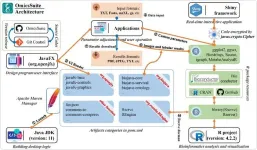
OmicsSuite is an innovative framework for analyzing and visualizing multi-omics data in a workflow (Fig. 1). The JavaFX library provides user interface (UI) control methods, parameter component classes, web engine support, and other interface display and friendly interaction functions through a series of sub-libraries such as javafx-controls, javafx-graphics, and javafx-web. The interfaces and analysis parameters of all 175 sub-applications are implemented through various components provided by JavaFX. Each sub-application provides essential interfaces such as uploading example datasets or user data files, parameter synchronization and feedback, and outputting results. Rserve and REngine provided by org.rosuda.REngine (https://github.com/s-u/REngine/) as two special and critical libraries are used to implement real-time communication with the R environment through daemon threads. Correspondingly, the Rserve function is utilized to provide instant responses to Java call signals. Although OmicsSuite is used by Java and R as the real-time running environment and function execution environment respectively, and has a large number of built-in Java and R modules, and even the Shinyapp framework. But easily users only need to install based on binary file to use the full functionality out of the box, without any additional configuration environment and dependencies. Basically, a computer device with a 4-cores CPU, 4G memory, and 256G storage can perform normal operations of OmicsSuite. We recommend providing a minimum of 6-cores CPU and 8GB memory for single-cell analysis, with a test PBMC (Peripheral Blood Mononuclear Cells) dataset (including 2700 single cells) execution time of approximately 3 minutes.
UI design and data interface
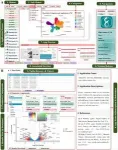
OmicsSuite has redesigned the UI of JavaFX to provide a modern and improved operating experience for users. The default layout features a multi-level menu bar at the top of the window, a shortcut access bar at the bottom, a collapsible toolbox on the left, a home page in the middle, and a meta information and version update record panel on the right (Fig. 2A). The menu bar allows users to quickly launch sub-applications based on multi-level categorization. When a sub-application is started, the layout will switch to the user interface, with the analysis page of the application in the middle and application details information (Fig. 2B) on the right. The analysis page is comprised of a data section, a parameter component section, and a result section from top to bottom. The fixed components Progress, Demo, Clear, and Submit are part of the task management components used to display the current status, run example data, clear the current task, and submit a new task respectively. Other common components such as Themes, Colors, Fonts, Figure Width, Figure Height, and Figure DPI belong to the parameter specification components. These components implement a unified theme and color scheme for OmicsSuite and standardize the default output image in 10.00 × 6.18-inch (300 dpi) form, following the golden ratio.
Sub-applications overview and classification
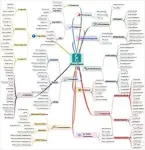
Bioinformatics encompasses biology (such as multi-omics) and methodology (such as statistics and advanced algorithms). Therefore, OmicsSuite continuously improves multi-omics analysis and visualization functions based on the foundation of statistical analysis, providing users with a comprehensive one-stop solution. Currently, there are 12 categories with 175 sub-applications. The categories are: Sequence, Statistics, Algorithm, Genomics, Transcriptomics, Enrichment, Proteomics, Metabolomics, Clinical, Microorganisms, Single Cell, and Table Operation (Fig. 3). OmicsSuite can analyze almost all multi-omics data, and each classification corresponds to different types of professional data formats. Applications in the OmicsSuite Sequence category typically require a FastA format sequence file, applications in the Genomics category require data in MAF file (Mutation Annotation Format); applications in the Metabolomics category require compressed mzML format files, and users need to provide compressed Matrix or HDF5 format files for the Single-Cell category.
To summarize, the key features of OmicsSuite include: 1) User-friendly interactive experience, convenient demo running button, complete parameter components, and table and image preview windows. 2) Comprehensive coverage of multi-omics analysis and visualization functions, particularly in metabolomics and single-cell analysis workflows. 3) OmicsSuite supports reading most multi-omics raw files, such as LC-MS data mzML format, single-cell 10x genomics Chromium matrix format, and Visium HDF5 format data. 4) OmicsSuite provides a complete basic visualization system, intuitive operation interface for dimensionality reduction algorithms (PCA, PCoA, tSNE, etc.) and clustering algorithms (Kmeans, Hclust, AGNES, etc.), and a SEM model construction and evaluation system.
1 Caporaso JG, Lauber CL, Walters WA et al. Ultra-high-throughput microbial community analysis on the Illumina HiSeq and MiSeq platforms. ISME J 2012; 6: 1621–1624.
2 Rhoads A, Au KF. PacBio Sequencing and Its Applications. Genomics, Proteomics Bioinforma 2015; 13: 278–289.
3 Jain M, Olsen HE, Paten B, Akeson M. Erratum to: The Oxford Nanopore MinION: Delivery of nanopore sequencing to the genomics community [ Genome Biol. (2016), 17, 239] DOI:10.1186/s13059-016-1103-0. Genome Biol 2016; 17: 95064.
4 Olivier M, Asmis R, Hawkins GA, Howard TD, Cox LA. The need for multi-omics biomarker signatures in precision medicine. Int J Mol Sci 2019; 20. doi:10.3390/ijms20194781.
5 Joseph LC, Shi J, Nguyen QN et al. Combined metabolomic and transcriptomic profiling approaches reveal the cardiac response to high-fat diet. iScience 2022; 25. doi:10.1016/j.isci.2022.104184.
6 Turewicz M, Deutsch EW. Spectra, Chromatograms, Metadata: mzML-The Standard Data Format for Mass Spectrometer Output. Methods Mol Biol 2011; 696: 179–203.
7 Gao C, Zhang M, Chen L. The Comparison of Two Single-cell Sequencing Platforms: BD Rhapsody and 10x Genomics Chromium. Curr Genomics 2020; 21: 602–609.
8 Fisch KM, Meißner T, Gioia L et al. Omics Pipe: A community-based framework for reproducible multi-omics data analysis. Bioinformatics 2015; 31: 1724–1728.
The article “OmicsSuite: a customized and pipelined suite for analysis and visualization of multi-omics big data” has been published in Horticulture Research.
###
References
Authors
Ben-ben Miao1,†,* , Wei Dong2,† , Yi-xin Gu4 , Zhao-fang Han1 , Xuan Luo1 , Cai-huan Ke1 , Wei-wei You1,3*
†These authors contributed equally to this work.
Affiliations
1. State Key Laboratory of Marine Environmental Science, College of Ocean and Earth Sciences, Xiamen University, Xiamen 361102, Fujian, China.
2. Hospital of Stomatology, Guanghua School of Stomatology, Guangdong Provincial Key Laboratory of Stomatology, Sun Yat-Sen University, Guangzhou 510055, Guangdong, China.
3. Fujian Institute for Sustainable Oceans, Xiamen University, Xiamen 361102, Fujian, China.
4. College of Fisheries, Guangdong Ocean University, Zhanjiang 524088, Guangdong, China.
About Wei-wei You
Wei-wei You is a professor and doctoral supervisor at the College of Ocean and Earth Sciences, Xiamen University. Committed to the study of shellfish genomics and genetic breeding, and the response of marine shellfish to global change. He has published more than 180 academic papers as the first author, corresponding author or participating author in Reviews in Aquaculture, Molecular Ecology Resources, Aquaculture, Science of the Total Environment and other journals.
END
