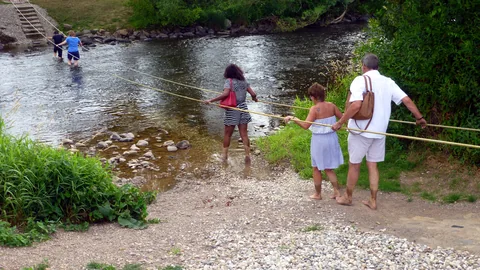
In Andong, South Korea, older adults who joined a supervised barefoot walking programme completed more steps in two minutes after ten weeks. People who continued their usual routines completed slightly fewer. A side-by-side look at the starting scores and the two changes makes the result useful for understanding what a control group can tell us.
- Thirty adults aged 60 to 79 enrolled. Twelve in the walking group and 13 in the control group completed the study.
- The walking group averaged 113.33 steps at baseline and 126.33 afterwards. The control group went from 95.85 to 91.00.
- The comparison captures a supervised programme versus usual routines. A footwear comparison would give both groups an equivalent walking programme.
- Paper date
- 21 November 2026
- Enrolled
- 30 adults aged 60 to 79
- Completed
- 25 adults
- Time between tests
- 10 weeks
Original publication: 21 Nov 2026 · The date above refers to this brief.
Average repetitions on the two-minute step test
repetitions
What was held constant in the comparison?
Same test
Both groups performed the two-minute step test at baseline and at follow-up.
Different routines
One group chose the supervised programme. The other continued its usual routine.
A follow-up could match walking time
Hold training and support constant, then examine footwear as a separate factor.
Read the starting scores before reading the finish
Participants decided whether to take part in supervised walking. At baseline the eventual programme completers were already 17.48 steps ahead on the two-minute step test. The raw group mean rose by 13.00 in that group and fell by 4.85 in the usual-routine group. Subtracting those two changes gives 17.85 steps. This is arithmetic on the reported means for completers. The researchers separately fitted a statistical model that adjusted for age, and other group differences could still influence the result.
Source 1 ↗The measured outcome was performance on a test
The step test counts repetitions within two minutes. The paper also reports differing changes on a chair stand and a figure-of-eight walking test. For the Timed Up and Go test, the groups did not show a clear difference in change. Other outcomes, including blood pressure, fasting glucose and lipids, had no statistically clear group-by-time differences. These measures capture different aspects of functioning and health. With a small sample and several outcomes, repeat studies would help establish how consistently the pattern appears.
Source 1 ↗The control group defines what the comparison can answer
The programme offered supervised sessions and a changing walking surface. The comparison group continued its usual activities. Any difference between the groups could reflect participation, training, attention or the surface, as well as footwear and baseline differences. An experiment to isolate footwear would assign comparable participants to walk the same route for the same time with similar support and change the footwear condition. A follow-up could then check whether the difference persists beyond the supervised programme.
Source 1 ↗What changes when the outcome is walking in daily life?
The earlier LIFE trial randomly assigned 1,635 older adults to structured physical activity or health education. Its outcome concerned loss of the ability to complete a 400-metre walk over a much longer follow-up. That design addresses a separate question about mobility over time. It offers a comparison of outcomes and controls for readers interpreting a two-minute test in the Andong study.
Source 1 ↗Source 2 ↗Read the change and the comparator together
Publisher’s accepted full manuscript. Checked allocation, completion, the step-test means, Tables 3 and 4 and limitations. The publisher may revise this version in production.
01Did the walking group change more on the step test?
- What was observed
- The raw mean rose by 13.00 as the control group mean fell by 4.85.
- Where the conclusion stops
- The selected groups started at different average scores. The calculation does not adjust for age or other characteristics.
Source 1 · Results, Table 4
02Which programme feature does the comparison isolate?
- What was observed
- The study compared the whole supervised programme with usual routines.
- Where the conclusion stops
- A comparison of matched walking programmes would address footwear specifically.
Source 1 · Methods and Limitations
Numbers you can inspect
| Measure | Value & unit | Origin & method |
|---|---|---|
| Participants enrolled | 30 people | Reported Initial sample of 15 per group. Source 1 · Figure 1 |
| Participants completing the study | 25 people | Reported 12 and 13 completers in the two groups. Source 1 · Figure 1 and Results |
| Completion share | 83.3 percent | Calculated Divide 25 by 30 and multiply by 100. Source 1 · Figure 1 |
| Walking mean before the programme | 113.33 repetitions | Reported Two-minute step test raw mean. Source 1 · Table 4 |
| Walking mean after the programme | 126.33 repetitions | Reported Two-minute step test raw mean. Source 1 · Table 4 |
| Control mean before the programme | 95.85 repetitions | Reported Two-minute step test raw mean. Source 1 · Table 4 |
| Control mean after the programme | 91 repetitions | Reported Two-minute step test raw mean. Source 1 · Table 4 |
| Walking group raw change | 13 repetitions | Calculated 126.33 minus 113.33. Source 1 · Table 4 |
| Control group raw change | -4.85 repetitions | Calculated 91.00 minus 95.85. Source 1 · Table 4 |
| Difference between the changes | 17.85 repetitions | Calculated 13.00 minus −4.85. This uses group means without covariate adjustment. Source 1 · Table 4 |
| Baseline raw difference | 17.48 repetitions | Calculated 113.33 minus 95.85. Source 1 · Table 4 |
Compare the actual experiments
These studies answer different questions. Read the unit and endpoint before comparing results.
| Study | Unit & setting | Readout | Interpretation boundary |
|---|---|---|---|
| Andong walking programme and LIFE trial Source 2 · Pahor et al., Methods | Self-selected groups and randomly assigned older adults | Two-minute step-test score and ability to complete 400 metres | The two outcomes and control conditions address different questions. |
| Usual routine and matched activity comparator Source 1 · Methods, study design and Limitations | Programme completers and a usual-routine group | Group changes in mobility tests | Matching walking exposure and support could bring the footwear question into focus. |
The export includes claims, available numbers, methods and source locations. It contains our reading notes and published summaries; it is not raw participant data or an independent reanalysis.
Evidence update · 22 Nov 2026
First publication. Any calculations in this brief use reported figures. The reading notes identify possible follow-up questions. AI source check; no human editorial or clinical review.
Read both group means and their changes
| Group | Raw means before and after | How to read the change |
|---|---|---|
| Walking group, 12 completers | 113.33 to 126.33 repetitions | Increase of 13.00 in the raw group mean. |
| Usual-routine group, 13 completers | 95.85 to 91.00 repetitions | Decrease of 4.85 in the raw group mean. |
| Difference between the two changes | 17.85 repetitions | Press-News computation using the two unadjusted changes. |
Table 4 raw means and arithmetic using those means.
Your questions, answered
Were the groups similar on the step test at the start?
The walking group mean was 113.33 repetitions versus 95.85 for controls, a difference of 17.48 before the programme.
Does 17.85 represent the study’s adjusted estimate?
It is the difference between two changes calculated from the raw group means. The paper separately reports the age-adjusted group-by-time model.
Did the comparison group do the same walks in shoes?
The comparison group continued its usual activities. The authors identify a matched walking comparison as a question for further study.
How does the earlier LIFE trial differ?
It randomly assigned activity or health education and followed the ability to complete a 400-metre walk over a longer period.
Limits of this interpretation
- Participants chose their group. The small sample allowed only age adjustment in the reported model.
- Five enrolled participants had no follow-up test and were excluded from the main analysis.
- The control group followed usual routines. An otherwise matched group walking in shoes would address the footwear question.
Sources & transparency
- Kim et al. (2026) — A 10-week community-based barefoot walking program in older adults
Publisher’s accepted full manuscript. Checked allocation, completion, the step-test means, Tables 3 and 4 and limitations. The publisher may revise this version in production. · Accessed 22 Nov 2026
DOI: 10.1186/s12889-026-30340-w - Pahor et al. (2014) — Effect of structured physical activity on prevention of major mobility disability in older adults
Published LIFE randomized trial. Checked group assignment, follow-up and the definition of major mobility disability. · Accessed 22 Nov 2026
DOI: 10.1001/jama.2014.5616
Prepared and source-checked with AI for Press-news Team. The source notes identify the material available during preparation. The article received no human editorial or clinical review. The source list supports the reported results and the calculations shown.
Source check: AI source check — primary research and stated source limits
Clinical review: Not applicable to this educational guide
Suggest a correction