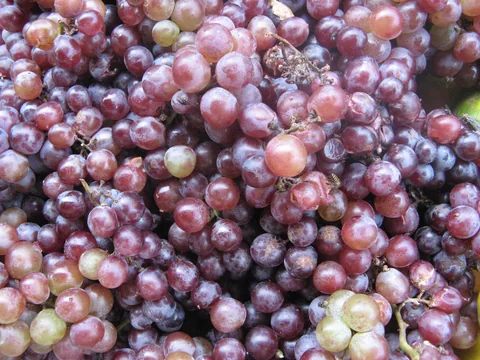
Someone recalls eating a handful of grapes. Elsewhere, a laboratory tests fruit sold in the United States. Joining those records gives researchers a way to estimate what a group consumed. No one tested the particular grapes on the respondent’s plate. That distance between the meal and the laboratory matters when interpreting the study’s most striking numbers.
- Four of 33 eligible pesticides met the authors’ comparison criterion in both U.S. survey cycles. Women had the higher estimated intake for each of the four.
- The gap was larger when expressed per kilogram of body weight. Estimates for total intake per day also differed between the groups.
- The researchers had dietary interviews and national residue data. To test whether the two groups absorbed different amounts, a study would also need measurements from participants.
- Paper date
- 22 November 2026
- Survey cycles
- 2017–2018 and 2021–2023
- Adults with body weights
- 8,351
- Main comparison
- Female-to-male ratio of average estimated intake per kilogram per day
Original publication: 22 Nov 2026 · The date above refers to this brief.
How much higher was the estimated intake per kilogram in the later survey?
percent above the male group mean, 2021–2023
How a meal becomes an exposure estimate
Record the meal
A participant reports foods and amounts eaten on a recall day.
Match each ingredient
The researchers link suitable ingredients to concentrations measured in the USDA program.
Compare the estimates
They aggregate intake, account for survey weights and compare groups on the same scale.
Follow a bunch of grapes through the analysis
The researchers started with two food recalls per person. They broke dishes into ingredients, matched ingredients to foods in the USDA monitoring program and used the residue data to estimate intake. A match to grapes contributed to the estimate for cyprodinil, a fungicide. The calculation could distinguish someone who reported eating grapes from someone who did not. It could not tell whether those two people bought fruit from the same farm, or whether either person’s actual serving contained that residue.
Source 1 ↗Source 2 ↗Source 3 ↗Put the units back into a headline ratio
In the later survey, the estimated group means for cyprodinil were 24.5 nanograms per kilogram of body weight per day in women and 14.2 in men. Divide the first number by the second and round to two decimals. The result is 1.73. That corresponds to a 73% higher group mean on this scale. A person weighing less can have a larger value per kilogram for the same daily intake. Here the authors also compared daily totals, and all four ratios remained above one.
Source 1 ↗Ask which foods the model could see
In the two survey cycles, ingredients mapped to the residue data accounted for 12.6% and 12.4% of weighted ingredient mass. Plain water made up a large part of the denominator. A useful question is whether the available matches cover the foods that contribute most to a particular compound. Subtracting 12.4 from 100 would tell you the share of ingredient mass outside the map. It would tell you nothing about the share of pesticide intake missed.
Source 1 ↗Which result deserves a closer look?
The team varied assumptions about matching foods and handling residue data. Under one alternative, the propargite ratio came down to 1.04. This makes the food-to-residue match especially important for that result. The authors also say that they finalised the rules for the 33-compound group after seeing exploratory comparisons. A follow-up could specify those rules in advance, recruit a new sample and pair repeated food records with appropriate biological measurements. That would test a new link in the chain.
Source 1 ↗Trace the food match, units and size of the difference
Full paper in Toxics. Checked participant selection, food mapping, Tables 1 and 2, the sensitivity analyses and the timing of the compound selection. Press-News recalculated the percentages in the chart from Table 2. The participant data were not reanalysed.
01What survived the comparison across cycles?
- What was observed
- Four compounds had higher female group means and met the authors’ criterion in both survey cycles.
- Where the conclusion stops
- Eligibility and the timing of decisions about the testing family limit interpretation.
Source 1 · Sections 2.5 and 3.1.2, Table 2
02Is a residue estimate a measure of internal exposure?
- What was observed
- The authors combined food recalls, body weight and monitored residue concentrations.
- Where the conclusion stops
- Individual biological samples would be required to examine absorbed exposure.
Source 1 · Sections 2 and 4, exposure model and limitations
Numbers you can inspect
| Measure | Value & unit | Origin & method |
|---|---|---|
| Adults with two reliable recalls and body weight | 8351 adults | Reported Denominator of the body-weight analysis. Source 1 · Figure 1 and Section 3.1 |
| Compounds in the main comparison | 33 compounds | Reported Eligible across both cycles under the paper’s evidence rules. Source 1 · Sections 3.1.1 and 3.1.2 |
| Compounds meeting the cross-cycle criterion | 4 compounds | Reported Four compounds in the test family. Source 1 · Table 2 |
| Cyprodinil estimated intake in women | 24.5 ng/kg/day | Reported Later cycle, survey-weighted average. Source 1 · Table 2 |
| Cyprodinil estimated intake in men | 14.2 ng/kg/day | Reported Later cycle, survey-weighted average. Source 1 · Table 2 |
| Later-cycle abamectin difference | 78 percent above male mean | Calculated (1.78 − 1) × 100. Source 1 · Table 2 |
| Later-cycle cyprodinil difference | 73 percent above male mean | Calculated (1.73 − 1) × 100. Source 1 · Table 2 |
| Later-cycle fenhexamid difference | 85 percent above male mean | Calculated (1.85 − 1) × 100. Source 1 · Table 2 |
| Later-cycle propargite difference | 71 percent above male mean | Calculated (1.71 − 1) × 100. Source 1 · Table 2 |
| Mapped ingredient mass, later survey | 12.4 percent | Reported Survey-weighted ingredient mass including plain water in the denominator. Source 1 · Section 3.1.1 |
Compare the actual experiments
These studies answer different questions. Read the unit and endpoint before comparing results.
| Study | Unit & setting | Readout | Interpretation boundary |
|---|---|---|---|
| USDA Pesticide Data Program Source 2 · USDA program description and sampling overview | Food sample selected for monitoring | Laboratory residue measurements | A sample of a commodity is separate from the food served to a survey participant. |
| NHANES dietary interview Source 3 · CDC documentation, component description and interview protocol | Food intake recalled for one day | Foods and amounts participants remember eating | The interview supplies the diet side of the linkage. Laboratory residue values come from another program. |
The export includes claims, available numbers, methods and source locations. It contains our reading notes and published summaries; it is not raw participant data or an independent reanalysis.
Evidence update · 22 Nov 2026
First publication. Any calculations in this brief use reported figures. The reading notes identify possible follow-up questions. AI source check; no human editorial or clinical review.
The same four comparisons in two U.S. surveys
| Pesticide | 2017–2018 ratio (95% CI) | 2021–2023 ratio (95% CI) |
|---|---|---|
| Abamectin | 1.91 (1.45–2.52) | 1.78 (1.47–2.15) |
| Cyprodinil | 1.62 (1.31–2.00) | 1.73 (1.42–2.10) |
| Fenhexamid | 1.65 (1.31–2.09) | 1.85 (1.53–2.23) |
| Propargite | 1.90 (1.30–2.78) | 1.71 (1.34–2.18) |
Table 2. Each value compares survey-weighted mean intake per kilogram in women with the corresponding mean in men. The cycle-specific intervals are unadjusted. A ratio of one marks equal estimates.
Your questions, answered
Did the laboratory test the food each person actually ate?
The lab data came from USDA sampling. The link to an individual’s meal was made through food and ingredient categories.
Why did the authors use body weight?
Dividing daily intake by weight puts differently sized adults on a common scale. Daily intake in milligrams answers a separate question about the total amount consumed.
Does a 73% higher estimate mean a 73% higher health risk?
The 73% comes from a ratio of two estimated means for one fungicide. A health-risk comparison would need an outcome and information connecting the exposure to that outcome.
Why is the mapped share of food so small?
The denominator includes all ingredient mass, including plain water. The model matches particular commodities to monitoring data. The reported coverage cannot establish the share of exposure captured.
Limits of this interpretation
- A two-day recall samples a short stretch of diet. It cannot establish an individual’s usual long-term intake.
- Survey respondents and the food samples came from separate programs. The study did not measure individual absorption, hormone levels or disease outcomes.
- The estimates depend on mapping and selection decisions. Reviewing preliminary estimates before fixing the compound group complicates interpretation of the multiple-testing adjustment.
Sources & transparency
- Gorbatov and Nieva (2026) — Sex Differences in Modeled Dietary Intake of Pesticides with Evidence of Endocrine Activity Among U.S. Adults
Full paper in Toxics. Checked participant selection, food mapping, Tables 1 and 2, the sensitivity analyses and the timing of the compound selection. Press-News recalculated the percentages in the chart from Table 2. The participant data were not reanalysed. · Accessed 22 Nov 2026
DOI: 10.3390/toxics14121033 - USDA Agricultural Marketing Service — The Pesticide Data Program
USDA’s description of its surveillance program and the food samples tested for residues. · Accessed 22 Nov 2026
- CDC / NCHS — 2021–2023 NHANES dietary interview documentation
First-day dietary file documentation for the later survey cycle. Checked what the interview records and how the two dietary interviews are organised. · Accessed 22 Nov 2026
Prepared and source-checked with AI for Press-news Team. The source notes identify the material available during preparation. The article received no human editorial or clinical review. The source list supports the reported results and the calculations shown.
Source check: AI source check — primary research and stated source limits
Clinical review: Not applicable to this educational guide
Suggest a correction