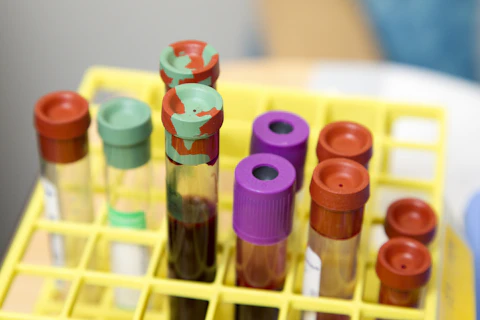
A genetic score developed elsewhere may behave differently in a local population. A new biobank study addresses that problem by combining published scores—but reading its result still requires three separate questions about prediction.
- Ranking people correctly does not establish accurate absolute probabilities.
- A held-out local test is different from a test in a new health system.
- The accepted HTML and PDF summaries currently disagree numerically; this article does not select one as definitive.
- Paper date
- 23 October 2026
- Design
- Predictive-model evaluation in two biobanks
- Scope
- Methods and source checking; no individual risk assessment
Original publication: 23 Oct 2026 · The date above refers to this brief.
A prediction claim has three checkpoints
Separate
Keep model training and evaluation observations apart.
Specify
Name the metric, cohort and comparator for each result.
Translate
Ask what evidence connects the prediction to a useful decision.
What the study changes
Kim and colleagues combine previously published polygenic scores for coronary artery disease, breast cancer and prostate cancer. A locally trained model reweights those scores rather than discovering a new set of genetic associations. The evaluation uses UK Biobank and Mass General Brigham Biobank data. The reported direction is improved predictive discrimination within the studied comparisons.
Source 1 ↗Ranking, calibration and usefulness are separate
A C-statistic measures how well a model ranks cases relative to non-cases. Probability calibration asks whether predicted risks match observed frequencies over a defined time horizon. Clinical usefulness asks whether decisions based on the score improve outcomes at an acceptable cost.
Our assessment keeps these in separate columns. Calling a procedure “post-PRS calibration” describes the authors’ adaptation framework; it does not make a higher C-statistic proof that absolute probabilities are calibrated. A favourable ranking result also cannot replace an intervention study.
Follow the training boundary
The Methods describe a 70% training and 30% held-out test split, with tuning inside the training data. That separation matters because evaluating a fitted model on the same observations used to optimise it can exaggerate performance. A held-out subset of an existing cohort still shares much of that cohort’s setting; it is not equivalent to future validation in a different health system.
Source 1 ↗A source-version check changes how we quote the result
On 23 October, the readable publisher HTML abstract reports average C-statistic improvements of 19.8%, 9.4% and 8.3% for coronary artery disease, prostate cancer and breast cancer. The downloaded accepted PDF abstract reports 20.5%, 9.8% and 8.0%, respectively. These are source-version observations, not six independent results. We have not established why they differ and do not choose a definitive improvement percentage.
The paper is an early accepted version that may change. Readers comparing it later should check the version, metric, cohort and comparator together. The evidence export preserves both summaries with separate source locations.
Source 1 ↗Source 2 ↗What remains to be demonstrated
Our next reading questions concern performance in new settings, calibration within relevant groups and the consequences of a specified decision threshold. A score can identify more existing cases partly by flagging a different number of people; that is not automatically a fair comparison at a fixed testing budget.
The publisher discloses commercial relationships for several authors, including consulting, research support, advisory roles and company interests. Those disclosures belong beside the methods; they do not by themselves invalidate the findings. We have not audited code, individual records or prospective clinical benefit. This is a guide to reading prediction evidence, not a recommendation to order a genetic test or alter care.
Source 2 ↗Metric, cohort and source version stay together
Selected accepted PDF: abstract p.1, Results pp.2–4, Fig. 4 and caption p.5, Discussion limitations and validation Methods pp.9–10. Fig. 4 visually inspected. Numerical summary differs from the publisher HTML abstract observed on 23 October; no resolution established. Publisher HTML metadata and abstract also checked. Supplements, source-data files, code and clinical records were not independently audited. No publisher figure reproduced. The accepted version may receive further edits.
01Is there one verified headline improvement percentage?
- What was observed
- The readable HTML and downloaded PDF abstracts contain different improvement summaries in the checked versions.
- Where the conclusion stops
- We document the discrepancy without resolving which summary is correct.
Source 1 · Accepted PDF p.1, compared with publisher HTML Abstract observed 23 October 2026
02What prevents tuning on the test set?
- What was observed
- The Methods describe training-only optimisation followed by held-out evaluation.
- Where the conclusion stops
- We did not execute the code, and local hold-out evaluation is not a trial of clinical utility.
Source 1 · PDF pp.9–10; Local optimization Methods
Numbers you can inspect
| Measure | Value & unit | Origin & method |
|---|---|---|
| Training split | 70 percent of analysed dataset | Reported Model-development partition, not a clinical response rate. Source 1 · PDF p.9; Local optimization Methods |
| Held-out test split | 30 percent of analysed dataset | Reported Evaluation partition, not an external health-system validation. Source 1 · PDF p.9; Local optimization Methods |
| CAD improvement summary — HTML | 19.8 percent, as printed | Reported Version observation only; not adjudicated or converted into an absolute C-statistic gain. Source 2 · HTML Abstract, observed 23 October 2026 |
| CAD improvement summary — accepted PDF | 20.5 percent, as printed | Reported Version observation only; not an independent result or a definitive effect estimate. Source 1 · Accepted PDF p.1; Abstract |
| Prostate cancer improvement summary — HTML | 9.4 percent, as printed | Reported Version observation only; not adjudicated or converted into an absolute C-statistic gain. Source 2 · HTML Abstract, observed 23 October 2026 |
| Prostate cancer improvement summary — accepted PDF | 9.8 percent, as printed | Reported Version observation only; not an independent result or a definitive effect estimate. Source 1 · Accepted PDF p.1; Abstract |
| Breast cancer improvement summary — HTML | 8.3 percent, as printed | Reported Version observation only; not adjudicated or converted into an absolute C-statistic gain. Source 2 · HTML Abstract, observed 23 October 2026 |
| Breast cancer improvement summary — accepted PDF | 8 percent, as printed | Reported Version observation only; not an independent result or a definitive effect estimate. Source 1 · Accepted PDF p.1; Abstract |
Compare the actual experiments
These studies answer different questions. Read the unit and endpoint before comparing results.
| Study | Unit & setting | Readout | Interpretation boundary |
|---|---|---|---|
| Published-score comparison Source 1 · PDF pp.2–4; Results | Scores calculated in biobank cohorts | Correlation and prediction comparisons | Agreement between scores is distinct from whether acting on them helps. |
| Local model evaluation Source 1 · PDF p.5 Fig. 4 caption; pp.9–10 Methods | Training and held-out observations | Discrimination after local adaptation | No universal probability calibration or prospective decision benefit follows. |
The export includes claims, available numbers, methods and source locations. It contains our reading notes and published summaries; it is not raw participant data or an independent reanalysis.
Evidence update · 23 Oct 2026
First publication. Observations, our arithmetic and proposed follow-up questions are separated. No raw-data reanalysis. AI source check; no human editorial or clinical review.
Three tests a prediction headline should pass
| Reading question | Evidence to retain | What remains open |
|---|---|---|
| Does it rank well? | Held-out discrimination and its comparator | Calibration of absolute probabilities |
| Does the probability mean what it says? | Observed frequencies, subgroup and time horizon | Performance under another population’s baseline risk |
| Does using it help? | Decision threshold, harms and downstream outcomes | Prospective benefit compared with usual decisions |
| Which version supplied the number? | HTML/PDF location and access date | Whether the final version reconciles the summaries |
Original Press-News assessment framework. Follow-up questions are our interpretation, not additional experiments performed by the authors.
Your questions, answered
Did the authors discover new genetic variants?
This framework combines and locally reweights existing polygenic scores; it is not a new discovery-stage genome-wide association study.
Does a better C-statistic prove better calibrated risk?
No. Ranking and agreement between predicted probabilities and observed frequencies require different checks.
Which improvement percentage should we quote?
The accepted HTML and PDF summaries differ in the versions checked on 23 October. We record both and leave the discrepancy unresolved.
Can I use these numbers to estimate my own risk?
No. This article does not calculate personal risk or assess whether a particular test or care decision is appropriate.
Limits of this interpretation
- The accepted HTML and PDF improvement summaries differ; no resolution has been established.
- C-statistic, absolute-risk calibration and clinical utility answer different questions.
- A local held-out test does not prove transfer to every ancestry group or health system.
- Code, individual records and prospective effects of acting on scores were not audited.
Sources & transparency
- Kim, Sui, Patel et al. (2026): Fine-tuning of polygenic score to local data improves risk prediction and clinical implementation — accepted PDF
Selected accepted PDF: abstract p.1, Results pp.2–4, Fig. 4 and caption p.5, Discussion limitations and validation Methods pp.9–10. Fig. 4 visually inspected. Numerical summary differs from the publisher HTML abstract observed on 23 October; no resolution established. Publisher HTML metadata and abstract also checked. Supplements, source-data files, code and clinical records were not independently audited. No publisher figure reproduced. The accepted version may receive further edits. · Accessed 23 Oct 2026
DOI: 10.1038/s41467-026-77770-z - Same study: publisher HTML abstract and competing-interest statement, observed 23 October 2026
Readable publisher HTML abstract and competing interests checked through the web tool. The abstract reports different improvement summaries from the downloaded accepted PDF. Direct local HTML retrieval did not return a verified article page; it is not counted as an independently downloaded full HTML text. No numerical discrepancy resolved by us. · Accessed 23 Oct 2026
DOI: 10.1038/s41467-026-77770-z
Prepared and source-checked with AI. Press-news Team is the collective publication byline, not a medical reviewer. No human editorial or clinical review has taken place. This educational article examines research methods, model evaluation and laboratory or observational findings, not individual diagnosis or treatment. We did not conduct these experiments or reanalyse raw data. Reported results, our interpretation and proposed future tests are separated. Source-access limits are recorded below. Photographs are illustrative.
Source check: AI source check — selected primary PDF results, captions and study boundaries
Clinical review: Not applicable to this educational guide
Suggest a correction