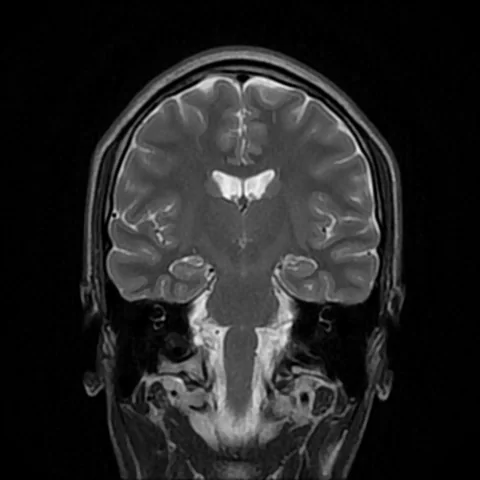
A model can estimate how old a scan looks and compare the prediction with the person’s age. A new review asks whether this difference is associated with later health outcomes. The simplest way to read the result is to keep track of three things: the size of the gap, the outcome and the studies behind the estimate.
- The review included 40 studies. Twenty-one contributed to at least one pooled analysis, and 16 contributed to the analysis of deaths from any cause.
- For each five-year larger imaging age gap, the pooled hazard ratio for deaths from all causes was 1.31 (95% CI 1.19 to 1.44).
- Estimates varied substantially. The larger chest-imaging result came from a single study, while eight studies contributed to the brain subgroup.
- Paper date
- 19 November 2026
- Studies in review
- 40
- All-cause mortality analysis
- 16 studies, 24 estimates
Original publication: 19 Nov 2026 · The date above refers to this brief.
From image to association
Estimate age
A model predicts age from features in an image.
Calculate the gap
Compare the prediction with the recorded age.
Compare later outcomes
Examine how outcomes change with the gap in each cohort, then assess variation across studies.
The gap is an output of a model
An imaging model estimates age from features it finds in a scan. For example, an estimate of 65 for someone aged 60 gives an age gap of five years in that model. The authors combined results for different models and imaging methods. They rescaled the associations to a common five-year increment where feasible, using assumptions from the underlying time-to-event models.
Source 1 ↗Source 2 ↗Read the hazard ratio in its proper units
The estimate of 1.31 compares the modeled rate of death at a given point in follow-up for people whose imaging age gaps differ by five years. Under the models, that corresponds to a 31% higher hazard. An absolute probability would also need a baseline and a time horizon. The pooled estimate summarizes associations across studies with different follow-up periods and adjustment choices.
Source 1 ↗Source 2 ↗Why the highest estimate deserves a second look
The overall estimate came from 24 estimates reported by 16 studies. The review reported substantial variation across them, with I² of 96.3%. In the organ groups, brain age estimates came from eight studies and yielded a hazard ratio of 1.51. The chest estimate of 2.20 came from one study. Confidence intervals describe the uncertainty around those estimates. Evidence across different settings would be needed to compare the usefulness of the imaging methods.
Source 1 ↗Source 2 ↗An extra paper does not always add a new cohort
The UK Biobank contributed data to 24 of the 40 studies reviewed. Papers using the same cohort can share participants, and one paper can report results for several organs. The authors examined the sensitivity of the analysis to some dependencies and acknowledge that some estimates could still be related. The number of reports gives a different kind of information from the number of independently studied populations.
Source 1 ↗Source 2 ↗What would answer a clinical question
An association can justify further evaluation. A model intended for care would need to show how well it predicts outcomes in new populations and whether it improves decisions compared with existing information. This review chiefly summarizes outcomes in observational cohorts, and the accepted paper identifies gaps in evaluation in clinical settings.
Source 1 ↗Source 2 ↗The interpretation depends on the denominator and the outcome
Primary full accepted manuscript used to check the figures, table and methods. Layout and wording may change at final publication.
01Can a 1.31 hazard ratio be read as a person’s chance of death?
- What was observed
- It summarizes a relative association per five-year larger imaging age gap across 16 studies.
- Where the conclusion stops
- An absolute estimate needs baseline risk and a follow-up horizon in a relevant population.
Source 2 · Accepted PDF, all-cause mortality Results and Figure 4
02How much independent evidence backs the chest estimate?
- What was observed
- Table 1 lists one study and one estimate for the chest subgroup.
- Where the conclusion stops
- A larger point estimate alone gives little information about performance in new settings.
Source 2 · Accepted PDF, Table 1 and Discussion
Numbers you can inspect
| Measure | Value & unit | Origin & method |
|---|---|---|
| Studies included in review | 40 studies | Reported Qualitative review after screening and assessment. Source 2 · Accepted PDF, Figure 2 and Results |
| Studies in quantitative synthesis | 21 studies | Reported Number contributing to any pooled outcome. Source 2 · Accepted PDF, Figure 2 and Results |
| Share eligible for quantitative synthesis | 52.5 percent | Calculated 21 divided by 40 and multiplied by 100. The denominator is reports in the review. Source 2 · Accepted PDF, Figure 2 |
| Studies in all-cause mortality analysis | 16 studies | Reported Studies contributing to the pooled all-cause mortality estimate. Source 2 · Accepted PDF, Figure 4 and Table 1 |
| All-cause mortality effect estimates | 24 estimates | Reported Different results contributed by the 16 studies. Source 2 · Accepted PDF, Figure 4 and Table 1 |
| Pooled all-cause mortality association | 1.31 hazard ratio | Reported Per five-year larger imaging age gap. 95% CI 1.19 to 1.44. Source 2 · Accepted PDF, Figure 4 and Table 1 |
| All-cause mortality heterogeneity | 96.3 percent I² | Reported Reported heterogeneity statistic for the all-cause mortality estimates. Source 2 · Accepted PDF, Figure 4 and Table 1 |
| Chest imaging mortality association | 2.2 hazard ratio | Reported Single study in this subgroup. Per five-year larger imaging age gap. 95% CI 1.80 to 2.69. Source 2 · Accepted PDF, Table 1 |
| Reports using the UK Biobank | 24 studies | Reported Count in the entire set of 40 reviewed studies. Source 2 · Accepted PDF, eligibility and study characteristics |
Compare the actual experiments
These studies answer different questions. Read the unit and endpoint before comparing results.
| Study | Unit & setting | Readout | Interpretation boundary |
|---|---|---|---|
| Overall pooled association Source 2 · Accepted PDF, Results and Figure 4 | Sixteen cohort studies contributing 24 estimates | Relative all-cause mortality hazard per five years of age gap | The effect estimates varied considerably across studies. |
| Organ subgroup analysis Source 2 · Accepted PDF, Table 1 | Reports using specific imaging models | Brain estimate from eight studies and chest estimate from one | These subgroups differ in study composition and amount of evidence. |
The export includes claims, available numbers, methods and source locations. It contains our reading notes and published summaries; it is not raw participant data or an independent reanalysis.
Evidence update · 21 Nov 2026
First publication. Reported observations, arithmetic and proposed follow-up questions are separated. No raw-data reanalysis. AI source check; no human editorial or clinical review.
How much evidence supports each estimate?
| Comparison | Hazard ratio (95% CI) | Evidence behind the estimate |
|---|---|---|
| All-cause mortality overall | 1.31 (1.19 to 1.44) | 16 studies, 24 estimates, substantial variation across estimates. |
| Brain imaging subgroup | 1.51 (1.37 to 1.66) | Eight studies contributed. |
| Chest imaging subgroup | 2.20 (1.80 to 2.69) | One study contributed. |
| Cancer-specific mortality overall | 1.06 (0.96 to 1.18) | Different outcome. The interval includes 1.00. |
The estimates are standardized per five-year larger imaging age gap. The overall and organ-specific rows overlap, and the final row uses a different outcome.
Your questions, answered
How is the five-year gap defined?
It is a five-year difference in the imaging age gap, which compares an image-based age estimate with chronological age. The review standardized associations to that increment.
Does a hazard ratio give an absolute chance of death?
To estimate an absolute chance, you need a time window and an estimate of baseline risk. The reported ratio compares rates during follow-up.
Why are there 24 estimates but 16 mortality studies?
A study can supply more than one estimate, such as estimates from different organ models. The paper discusses possible dependence among estimates.
How many independent studies produced the chest estimate?
Table 1 lists one study and one estimate for chest imaging. Wider replication would show how it varies across settings.
Limits of this interpretation
- The review combines cohort associations with substantial variation by study and imaging method.
- Some estimates may share populations or come from different analyses of the same cohort.
- Imaging age depends on model training and correction choices. The accepted paper describes a lack of a common reference standard for biological age.
- Usefulness for patient decisions requires evaluation of absolute risks, calibration and benefits in new settings.
Sources & transparency
- Li, Wang, Cui et al. (2026): Imaging-based biological age gap and risk of mortality and incident diseases: a systematic review and meta-analysis
Publisher’s accepted article-in-press PDF. Checked study selection, quantitative Results, Figure 4, Table 1, Methods and Discussion. This is the version available on 21 November. Publisher metadata and abstract also checked. Supplements, source-data files, code and clinical records were not independently audited. · Accessed 21 Nov 2026
DOI: 10.1038/s41746-026-03472-x - Li et al. (2026): Accepted journal manuscript (PDF)
Primary full accepted manuscript used to check the figures, table and methods. Layout and wording may change at final publication. · Accessed 21 Nov 2026
Prepared and source-checked with AI. Press-news Team is the collective publication byline, not a medical reviewer. No human editorial or clinical review has taken place. This educational article examines published findings and how they were measured. Claims and calculations are based on the sources listed below. Photographs provide context for the topic.
Source check: AI source check — selected primary results, captions and study boundaries
Clinical review: Not applicable to this educational guide
Suggest a correction