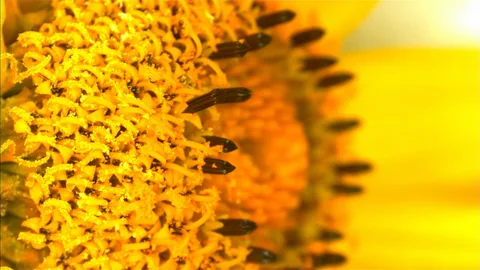
The spiky surface of sunflower pollen helped researchers build an optical sensor for TNF-α, a protein involved in inflammation. The work produced two kinds of evidence. A laboratory calibration estimated the weakest signal the instrument could distinguish from a blank. Saliva from three donors then showed that the team could obtain estimates in real specimens. A reader can compare those results by asking what went into each measurement.
- The reported detection limit was 0.34 attomoles per liter in the laboratory calibration.
- Tests in real saliva covered three people. The comparison used the same healthy donor in two figures.
- A diagnostic accuracy study would need a defined patient population, a cutoff and an independent reference standard.
- Paper date
- 21 November 2026
- Target
- Tumor necrosis factor alpha (TNF-α)
- Calibration detection limit
- 0.34 amol/L
- People in the saliva experiment
- 3
Original publication: 21 Nov 2026 · The date above refers to this brief.
How the three individual estimates compare on one scale
fmol/L
How to read the validation sequence
Calibrate the signal
Estimate how small a concentration produces a detectable signal under laboratory conditions.
Measure the same specimens independently
Compare estimates from the sensor and another assay in the same saliva samples.
Estimate classification errors
Measure overlap and false results with a predefined cutoff in a relevant population.
The detection limit describes the optical signal
The researchers used the surface of sunflower pollen as part of an optical measurement system. A change in the light spectrum tracked binding of TNF-α to the sensor. The paper reports a limit of detection of 3.4 × 10⁻¹⁹ mol/L from a calibration in buffer. Converting that value to attomoles per liter gives 0.34. The estimate comes from the fitted response and the variation expected around a blank. To judge trace measurements in saliva itself, a reader would also need precision and recovery data in that sample type.
Source 1 ↗Count the donors before counting the measurements
Figures 5 and 6 display several measurements made at different dilutions. They represent one healthy donor, one donor with peri-implantitis and one with oral cancer. The healthy sample was used as a comparison in both figures. The team estimated about 220 to 225 femtomoles per liter for that single shared donor, about 770 for the donor with peri-implantitis and about 3,000 for the donor with oral cancer. These are back-calculated concentration estimates from different people. The two values for the healthy specimen describe repeated estimates of that sample, so neither their range nor the gap between donors describes population variability.
Source 1 ↗How a reader can separate three claims
First ask whether the sensor registers the target in a controlled calibration. Next ask how accurately it measures the target in real samples compared with an independent assay. Then ask whether a predefined cutoff distinguishes people with and without the condition in the setting where the test would be used. One person in each group gives no usable estimate of how often concentrations overlap. The study makes its strongest case at the first stage and offers preliminary evidence at the second.
Source 1 ↗Source 2 ↗A follow-up would test overlap in a new set of patients
A validation study could recruit consecutively or otherwise describe how participants entered the study, include other causes of oral inflammation, and report the number of people above and below a prespecified cutoff against an independent reference. The STARD checklist helps readers find those details and check how uncertain the sensitivity and specificity estimates are. A follow-up of that kind could show whether the marker separates groups in practice.
Source 1 ↗Source 2 ↗From a detectable signal to a usable diagnostic result
Publisher publication record and accepted manuscript. The source check covers the calibration, saliva estimates in Figures 5 and 6, and the authors’ limits. The publisher labels this an early version that can change in production.
01Where did the detection limit come from?
- What was observed
- It was calculated from a model of the optical response in buffer.
- Where the conclusion stops
- Detection in that setting leaves the performance in diverse clinical samples open.
Source 1 · Analytical performance; Methods, limit of detection
02How many independent saliva donors were studied?
- What was observed
- Three people contributed saliva. The same healthy donor appears in both comparisons.
- Where the conclusion stops
- Repeated measurements provide information about the specimen and cannot establish group distributions.
Source 1 · Results, Figures 5 and 6
Numbers you can inspect
| Measure | Value & unit | Origin & method |
|---|---|---|
| Saliva donors | 3 people | Reported Count the healthy donor once across both figures. Source 1 · Results, Figures 5 and 6 |
| Detection limit in buffer | 3.4E-19 mol/L | Reported Authors’ estimate from the calibration curve. Source 1 · Analytical performance; Methods, limit of detection |
| Detection limit converted to attomolar | 0.34 amol/L | Calculated Divide 3.4 × 10⁻¹⁹ mol/L by 10⁻¹⁸ mol per amol. Source 1 · Analytical performance |
| Healthy donor, first comparison | 220 fmol/L | Reported Approximate estimated concentration in the common healthy sample. Source 1 · Results, Figure 5 |
| Healthy donor, second comparison | 225 fmol/L | Reported Second approximate estimate for the same participant. Source 1 · Results, Figure 6 |
| Donor with peri-implantitis | 770 fmol/L | Reported Approximate concentration for a single participant. Source 1 · Results, Figure 6 |
| Donor with oral cancer, converted | 3000 fmol/L | Calculated Multiply the reported approximation of 3 pmol/L by 1,000. Source 1 · Results, Figure 5 |
Compare the actual experiments
These studies answer different questions. Read the unit and endpoint before comparing results.
| Study | Unit & setting | Readout | Interpretation boundary |
|---|---|---|---|
| Laboratory calibration and same-sample comparisons Source 1 · Calibration and Saliva analysis | Blank, calibration series and donor specimens | Detectable optical response and concentration estimates | Specimen-level analytical agreement needs independent measurements in varied saliva samples. |
| STARD and diagnostic accuracy Source 2 · STARD 2015 Table 1 | People from an intended-use population | Sensitivity, specificity and their uncertainty | A classification study would use a stated reference standard and explain when and how the cutoff was chosen. |
The export includes claims, available numbers, methods and source locations. It contains our reading notes and published summaries; it is not raw participant data or an independent reanalysis.
Evidence update · 22 Nov 2026
First publication. Any calculations in this brief use reported figures. The reading notes identify possible follow-up questions. AI source check; no human editorial or clinical review.
Three concentration estimates from individual donors
| Donor | Estimated TNF-α concentration | How to read it |
|---|---|---|
| Healthy comparison donor | About 220 and 225 fmol/L | Two figures use saliva from the same person. |
| Donor with peri-implantitis | About 770 fmol/L | One participant with an inflammatory oral condition. |
| Donor with oral cancer | About 3,000 fmol/L | One participant. Converted from about 3 pmol/L. |
Original comparison based on the Results and Figures 5 and 6. Estimates represent individuals.
Your questions, answered
What does 0.34 amol/L mean?
It is a unit conversion for the reported detection limit from calibration in buffer. One attomole equals 10⁻¹⁸ moles.
Were there three donors or more?
Three donors supplied saliva. Figures 5 and 6 show several readings, and both use the same healthy donor for comparison.
Can I read the chart as a range for each condition?
Each bar displays an estimate from one person. A study with many individuals in each group would be necessary to show ranges or overlap.
Would a low detection limit guarantee few false positives?
A detection limit describes the laboratory signal. False positives depend on the cutoff and how results are distributed among people without the condition.
Limits of this interpretation
- The limit of detection comes from calibration in buffer. The sample-level estimates rely on applying that calibration to diluted saliva and correcting for dilution.
- There was a single person per donor category, including one healthy comparison donor reused across figures.
- The authors call for larger cohorts and comparison with a reference assay.
Sources & transparency
- Annunziata, Cennamo, Stampone et al. (2026) — Advanced pollen-based nanoplasmonic biosensing platforms for salivary TNF-α monitoring
Publisher publication record and accepted manuscript. The source check covers the calibration, saliva estimates in Figures 5 and 6, and the authors’ limits. The publisher labels this an early version that can change in production. · Accessed 22 Nov 2026
DOI: 10.1038/s41598-026-81496-9 - Bossuyt et al. (2015) — STARD 2015 reporting checklist for diagnostic accuracy studies
Original consensus reporting statement, specifically the checklist for participants, reference standards, cutoffs and accuracy estimates. · Accessed 22 Nov 2026
DOI: 10.1136/bmj.h5527
Prepared and source-checked with AI for Press-news Team. The source notes identify the material available during preparation. The article received no human editorial or clinical review. The source list supports the reported results and the calculations shown.
Source check: AI source check — primary research and stated source limits
Clinical review: Not applicable to this educational guide
Suggest a correction