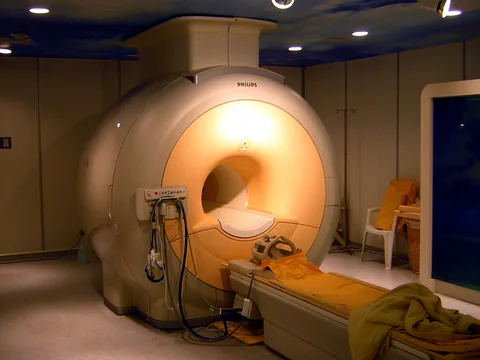
A person can listen to a story in the scanner and then move a hand. The task changes while the person stays the same. Siu and colleagues asked which way of describing a scan makes those task periods most distinct. The simplest description used one number per region. The most elaborate combined regions in threes. The clearest separation came from the option in between.
- Maps based on how pairs of regions varied together gave the strongest grouping by task under the study’s analysis.
- The paper separately reports modest associations with conscientiousness and with internalizing and externalizing symptom scores.
- The authors’ earlier manuscript describes 394 people in the exploration group and 319 in the replication group. A larger, overlapping sample was used to study behavior.
- Paper date
- 22 November 2026
- Source of scans
- Human Connectome Project, Young Adult dataset
- Representations compared
- Individual regions, pairs and triplets
- Primary comparison
- How distinctly the maps grouped task conditions
Original publication: 22 Nov 2026 · The date above refers to this brief.
How many features can eight signals produce?
features in a worked example
Read the map and the behavioral result separately
Choose a representation
Use regions, pairs of regions or triplets at each point in time.
Check the task labels
Measure how closely observations from the same task group together.
Compare across people
Ask whether a summary of the map is associated with questionnaire scores.
What changes when you look at pairs?
A regional signal describes how the activity measured in one part of the brain varies over time. In the author manuscript, the team standardised each regional signal before multiplying simultaneous values from pairs of regions. Consider two readings both above their own averages. Their product is positive. Two below-average readings can also give a positive product. The pair therefore captures a kind of coordination that a single high reading would miss. A triplet combines three readings at the same moment.
Source 1 ↗Source 2 ↗Why a more detailed representation need not win
Take an illustrative map with eight regions. There are 28 distinct pairs and 56 distinct triplets even before recording a second time point. Each additional feature is computed from the same eight signals. Adding combinations creates different views of the observation without recruiting anyone new. In the published comparison, the pair-based maps grouped time points from the same tasks more distinctly than either single-region or triplet-based maps. The chart shows the arithmetic of our example. The result about task separation comes from the scans.
Source 1 ↗Source 2 ↗Keep the two sample counts alongside the question
The May manuscript gives 394 people for exploration and a separate group of 319 for replication of the task analysis. It also describes a broader group of 968 for associations with behavior. That group includes the two smaller groups and additional participants, including siblings. Adding all three counts would count some people twice. The manuscript lists seven tasks, among them language, movement and working memory, alongside rest. These repeated conditions let the team ask how patterns change within the same person.
Source 2 ↗What task separation tells us about personality
The team measured how strongly task-labelled observations clustered on a map. The journal abstract describes modest relationships between that measure and several questionnaire scores. It does not report accuracy for identifying a new person’s symptoms or diagnosis. Marek and colleagues examined this distinction in separate resampling work. Estimates linking variation across people to behavior became more reproducible as sample sizes increased. A prospective prediction claim would require specifying an outcome, testing new people and reporting the errors.
Source 1 ↗Source 3 ↗Distinguish task grouping from a prediction about a person
Publisher abstract and publication record for the main comparison and direction of the associations. The cohort counts and construction details below are explicitly attributed to the authors’ earlier manuscript. No individual scan data were reanalysed.
01Which representation most clearly separated the tasks?
- What was observed
- The pairwise maps showed the strongest task grouping in the comparison.
- Where the conclusion stops
- The ranking belongs to this analysis and this outcome.
Source 1 · Journal abstract
02What did the study establish about behavioral measures?
- What was observed
- The published abstract reports modest associations with conscientiousness and internalizing and externalizing symptom dimensions.
- Where the conclusion stops
- The abstract does not supply an individual diagnostic accuracy result.
Source 1 · Journal abstract
Numbers you can inspect
| Measure | Value & unit | Origin & method |
|---|---|---|
| Types of representation | 3 representations | Reported Regional, pairwise and triplet inputs compared. Source 1 · Journal abstract |
| Exploration group | 394 people | Reported Earlier manuscript, initial task comparison. Source 2 · Author manuscript, Figure 1 and Methods |
| Replication group | 319 people | Reported Earlier manuscript, separate group for task comparison. Source 2 · Author manuscript, Figure 1 and Methods |
| Broader behavioral group | 968 people | Reported Includes the exploration and replication groups along with other participants. Source 2 · Author manuscript, Methods |
| People across the two task-analysis groups | 713 people | Calculated Add 394 and 319. The larger behavioral group overlaps both. Source 2 · Author manuscript, Figure 1 and Methods |
| Task conditions besides rest | 7 tasks | Reported List of experimental task paradigms. Source 2 · Author manuscript, Methods |
| Pairs in the eight-region example | 28 combinations | Calculated Press-News example with eight hypothetical regions. Compute 8 × 7 ÷ 2. Source 2 · Illustration of pair representation in author manuscript, Figure 1 |
| Triplets in the eight-region example | 56 combinations | Calculated Press-News example. Compute 8 × 7 × 6 ÷ 6 to count unordered triplets. Source 2 · Illustration of triplet representation in author manuscript, Figure 1 |
Compare the actual experiments
These studies answer different questions. Read the unit and endpoint before comparing results.
| Study | Unit & setting | Readout | Interpretation boundary |
|---|---|---|---|
| Task analyses in the author manuscript Source 2 · Author manuscript, Figures 1 and 2 | Two groups of Human Connectome Project participants | Grouping of scan frames by known task | Replication of a task pattern and prospective validation of an individual symptom forecast would use different endpoints. |
| Marek et al. brain-wide association study Source 3 · Marek et al., abstract and resampling analyses | Subsamples drawn from larger neuroimaging datasets | Reproducibility of between-person brain–behavior associations | This assesses sample-size effects on associations. It does not benchmark the new task maps. |
The export includes claims, available numbers, methods and source locations. It contains our reading notes and published summaries; it is not raw participant data or an independent reanalysis.
Evidence update · 22 Nov 2026
First publication. Any calculations in this brief use reported figures. The reading notes identify possible follow-up questions. AI source check; no human editorial or clinical review.
Keep the analysis groups attached to their questions
| Question | People in the author manuscript | What that group contributes |
|---|---|---|
| Which maps separate tasks? | 394 in the exploration group | Initial comparison of three representations. |
| Does task separation repeat? | 319 in the replication group | Second test of the comparison. |
| How does map structure relate to behavior? | 968 in the broader sample | Includes the two groups above and additional participants. |
Study groups as described in the May author manuscript. The third row overlaps with the first two.
Your questions, answered
Did the researchers try to read people’s thoughts?
They compared how clearly maps separated known experimental conditions, such as language and movement. The task labels came from the experiment.
Why are there 28 pairs for eight regions?
Each region has seven possible partners. That counts every pair twice, so eight times seven divided by two gives 28.
Can I add 394, 319 and 968 to get the total?
The author manuscript describes 968 as a broader sample that includes both task-analysis groups. Adding the counts would duplicate participants.
Can these maps establish a psychiatric diagnosis?
The published result is an association with symptom scores. Individual diagnosis would require an appropriate reference assessment and validation in a clinical population.
Limits of this interpretation
- Cohort counts and implementation details are from the earlier author manuscript. The journal abstract supports the main result and the directions of the associations.
- Pairs performed best on the chosen measure of task grouping. Other tasks, samples or measures could produce different rankings.
- Task separation within a person and an association across people answer different questions.
Sources & transparency
- Siu et al. (2026) — Topology of brain-wide co-fluctuations distinguishes task states and shows associations with personality and behavioral symptoms
Publisher abstract and publication record for the main comparison and direction of the associations. The cohort counts and construction details below are explicitly attributed to the authors’ earlier manuscript. No individual scan data were reanalysed. · Accessed 22 Nov 2026
DOI: 10.1038/s42003-026-11292-8 - Siu et al. (2026) — Author preprint on task states and behavioral symptom dimensions
Author manuscript posted in May. Checked Figure 1, Figure 2 and the participant methods. It documents the analysis groups and the construction of pair and triplet series. · Accessed 22 Nov 2026
DOI: 10.64898/2026.04.30.722005 - Marek et al. (2022) — Reproducible brain-wide association studies require thousands of individuals
Original large-dataset resampling study. Checked the distinction between task mapping and between-person associations, and how sampling affects reproducibility. · Accessed 22 Nov 2026
DOI: 10.1038/s41586-022-04492-9
Prepared and source-checked with AI for Press-news Team. The source notes identify the material available during preparation. The article received no human editorial or clinical review. The source list supports the reported results and the calculations shown.
Source check: AI source check — primary research and stated source limits
Clinical review: Not applicable to this educational guide
Suggest a correction