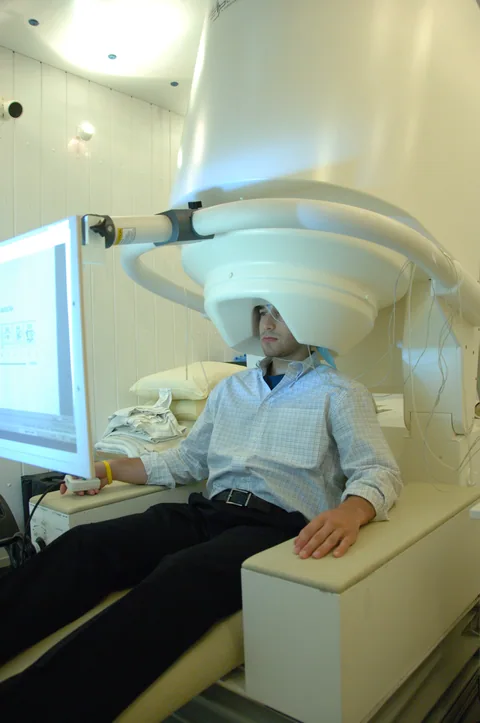
A single brain recording can be turned into many different numbers. A new comparison asks whether those numbers are interchangeable when researchers use them to study how the cortex responds.
- The authors compared ten measures from the same magnetoencephalography dataset and grouped them into six clusters.
- The paper describes 53 healthy people and 72 scans; scans are not additional independent participants.
- Its Results and Methods give different recording durations, a detail we could not resolve from the selected paper.
- Paper date
- 30 October 2026
- Participants
- 53 healthy adults
- Focus
- How brain-signal measurements relate
Original publication: 30 Oct 2026 · The date above refers to this brief.
Follow the signal through the analysis
Record
Measure magnetic signals at rest and during a defined sound condition.
Summarise
Compute different signal measures across reconstructed regions.
Compare
Group measures by similarity and retain the limits of each one.
What did the researchers measure?
Pellegrino and colleagues analysed whole-head magnetoencephalography, or MEG, which records magnetic fields associated with brain activity. They compared measures from rest with measures during a 40-hertz auditory stimulus. The study asks how differently defined research measures relate to one another; it does not establish a diagnostic test.
Source 1 ↗Ten measures are not ten separate experiments
The Results describe ten measures calculated after source reconstruction across 100 cortical regions: eight derived from resting activity and two from the auditory-stimulation condition. These measures include spectral, timing and complexity properties. They are different ways of summarising signals, not ten independent groups of people.
Source 1 ↗What six clusters mean
The authors used hierarchical clustering to group the ten measures by similarities in their spatial patterns. They report six clusters with limited redundancy. A cluster here is a statistical grouping of measures under this analysis; it should not be interpreted as the discovery of six new physical brain regions or six diagnoses.
Source 1 ↗People, scans and regions
The Methods report 53 individuals and 72 whole-head MEG scans. A scan is a recording, not an additional person. The 100 cortical regions are analysis parcels used to organise the reconstructed signal. Counting scans or parcels as separate participants would give a misleading impression of the study size.
Source 1 ↗A detail we could not reconcile
The accepted PDF has an apparent timing inconsistency: the Results describe two six-minute recordings, while the Methods say rest and auditory stimulation were five minutes each. The same Methods passage also describes 180 trials over six minutes. We have not established why these descriptions differ, so we do not select one duration as definitive.
Source 1 ↗How to read the next claim
The authors discuss relationships between signal patterns, cortical structure and reference maps of receptor density. These are spatial associations and indirect measures, not direct proof of the activity of a particular receptor in an individual. Our cell-atlas guide makes a related point: labels and analysis choices help organise data, but they are not a substitute for an independent reference.
The recording count is not the participant count
Selected accepted primary PDF: Results and measurement counts on p. 2, Fig. 2 on p. 3, and participant and recording Methods on p. 7. These pages were visually inspected. Results and Methods give different recording durations; the accepted version may be edited. Publisher HTML metadata and abstract also checked. Supplements, source-data files, code and clinical records were not independently audited. No publisher figure reproduced.
01What is grouped into six clusters?
- What was observed
- Ten derived excitability-related measures were grouped by spatial similarity.
- Where the conclusion stops
- These are statistical groups of measures, not six newly identified anatomical regions.
Source 1 · Accepted PDF pp. 2–3; Results and Fig. 2
02How long were the recordings?
- What was observed
- Results say two six-minute recordings; Methods say five minutes each and describe 180 trials over six minutes.
- Where the conclusion stops
- The difference is unresolved in our selected source check; we do not choose a definitive duration.
Source 1 · Accepted PDF pp. 2 and 7; Results and MEG recording Methods
Numbers you can inspect
| Measure | Value & unit | Origin & method |
|---|---|---|
| Healthy participants | 53 people | Reported Participant count reported in the Methods. Source 1 · PDF p. 7; participant Methods |
| Whole-head recordings | 72 scans | Reported Scans, not unique participants. Source 1 · PDF p. 7; participant Methods |
| Selected measures | 10 measures | Reported Eight resting-state and two stimulus-related measures. Source 1 · PDF p. 2; Results |
| Cortical parcels | 100 regions | Reported Analysis parcels after source reconstruction, not people. Source 1 · PDF p. 2; Results |
| Reported clusters | 6 clusters | Reported Clusters of measures produced by the stated hierarchical analysis. Source 1 · PDF pp. 2–3; Fig. 2 |
| Auditory modulation frequency | 40 hertz | Reported Frequency of the auditory-stimulation condition, not a treatment recommendation. Source 1 · PDF p. 2; Results |
Compare the actual experiments
These studies answer different questions. Read the unit and endpoint before comparing results.
| Study | Unit & setting | Readout | Interpretation boundary |
|---|---|---|---|
| Resting-state comparison Source 1 · PDF pp. 2–3 | Measures from recorded healthy-adult brain signals | Spatial similarity across cortical parcels | Different analyses of the same dataset are not independent cohorts. |
| Auditory-stimulation comparison Source 1 · PDF pp. 2 and 7 | 40-Hz auditory condition in the MEG study | Stimulus-related measures compared with other signals | A stimulus response is not a validated individual diagnosis. |
The export includes claims, available numbers, methods and source locations. It contains our reading notes and published summaries; it is not raw participant data or an independent reanalysis.
Evidence update · 31 Oct 2026
First publication. Reported observations, arithmetic and proposed follow-up questions are separated. No raw-data reanalysis. AI source check; no human editorial or clinical review.
Four units in the same brain study
| Reading question | Evidence to retain | What remains open |
|---|---|---|
| People | 53 healthy adults | A scan is not necessarily a new participant |
| Recordings | 72 whole-head MEG scans | Different reported recording durations remain unresolved |
| Measurements | Ten derived signal measures | Each measure is not a separate cohort |
| Clusters | Six groupings in the chosen analysis | A cluster is not a diagnosis or a newly discovered brain region |
Original Press-News reading framework. Follow-up questions are our interpretation, not experiments performed by the authors.
Your questions, answered
Were 72 people studied?
The Methods report 53 people and 72 scans. These are different units.
Are the six clusters six new brain regions?
No. They are groups of measurement types produced by a clustering analysis.
Does the paper establish a clinical test?
No. It compares research measures in healthy adults; an individual diagnostic use would need separate validation.
How long were the recordings?
The accepted paper is inconsistent: Results say six minutes each, while Methods say five minutes each and also describe 180 trials over six minutes. We have not resolved that difference.
Limits of this interpretation
- The study analyses healthy adults and does not validate an individual diagnostic threshold.
- MEG source reconstruction and the selected regional atlas shape the reported spatial patterns.
- The Results and Methods describe recording duration differently; the accepted paper may later be edited.
- We did not reanalyse the MEG recordings, code or supplementary data.
Sources & transparency
- Pellegrino, Duma, Schuler et al. (2026): Assessing whole-cortex excitability from electromagnetic brain signals
Selected accepted primary PDF: Results and measurement counts on p. 2, Fig. 2 on p. 3, and participant and recording Methods on p. 7. These pages were visually inspected. Results and Methods give different recording durations; the accepted version may be edited. Publisher HTML metadata and abstract also checked. Supplements, source-data files, code and clinical records were not independently audited. No publisher figure reproduced. · Accessed 31 Oct 2026
DOI: 10.1038/s42003-026-11005-1
Prepared and source-checked with AI. Press-news Team is the collective publication byline, not a medical reviewer. No human editorial or clinical review has taken place. This educational article examines research methods and laboratory or observational findings, not individual diagnosis or treatment. We did not conduct these experiments or reanalyse raw data. Reported results, our interpretation and proposed future tests are separated. Source-access limits are recorded below. Photographs are illustrative.
Source check: AI source check — selected primary PDF results, captions and study boundaries
Clinical review: Not applicable to this educational guide
Suggest a correction