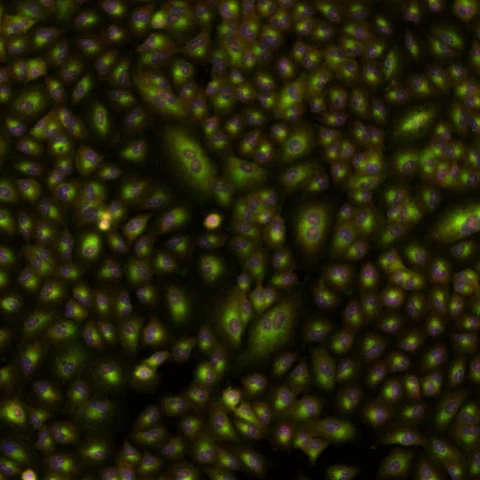
A microscope image contains far more detail than a simple healthy-or-unhealthy label. The question is whether a computer can turn patterns across many stained cells into a useful way to compare experiments.
- The authors trained four self-supervised model families on images of chemical perturbations and compared them with CellProfiler.
- The headline performance difference concerns a specific image-retrieval benchmark, not a patient outcome.
- Training without treatment labels does not mean that the cells were photographed without fluorescent stains.
- Paper date
- 29 October 2026
- Material
- Public Cell Painting image datasets
- Focus
- Training data, held-out comparisons and retrieval
Original publication: 29 Oct 2026 · The date above refers to this brief.
From a stained image to a testable comparison
Image
Photograph stained cells under a defined assay.
Represent
Convert each image into a numerical profile.
Evaluate
Test the ranking on a separately described dataset.
What the pictures contain
Cell Painting uses multiple fluorescent stains to reveal different structures in a cell. Researchers can expose cells to many compounds, photograph them and ask whether treatments with related effects produce similar image patterns. The authors compare conventional CellProfiler-derived profiles with four self-supervised image models: DINO, DINOv2, MAE and iTPN.
Source 1 ↗What the large training set counts
The models were pretrained on images associated with 119,876 unannotated compounds from seven laboratories, comprising about 1.77 million images. These are compounds and images in a research dataset, not 119,876 patients or successful medicines. The training stage did not require known treatment labels, although fluorescent dyes were used to produce the images.
Source 1 ↗A separate question for the test set
The held-out JUMP-Target2 comparison contained 302 annotated compounds. Fig. 1 shows that one source was held out entirely while the models were evaluated on annotated examples. The task was to retrieve related profiles: a good ranking means similar experimental profiles are found near one another under that benchmark. It does not independently establish why every compound acts as it does.
Source 1 ↗What the reported gain means
On the separate EU-OPENSCREEN Bioactives benchmark, the authors report 31–37% gains in site-averaged mean average precision for mechanism-of-action retrieval for DINO and DINOv2 relative to CellProfiler. This is a comparison of a ranking metric under the study settings; it is not a 31–37 percentage-point increase in the chance that a drug will help a person.
Source 1 ↗A closer look at independence
Multiple images can come from the same laboratory, plate or treatment. Counting all images as independent discoveries would overstate the breadth of the evidence. The study also tests datasets with different cell types and imaging conditions, which is useful for judging transfer; it cannot cover every future microscope, tissue or drug screen.
Source 1 ↗Where this fits with our other guides
Our single-cell atlas guide asks a similar question about labels: what reference was used, and what happens when the dataset or the settings change? Here the observation is a visual profile rather than a gene-expression profile. A useful next test would register a new imaging site and compare performance before and after a change of cell type, without selecting the winner afterward. That is our proposed check, not an experiment we performed.
Images, compounds and scores are different units
Selected primary paper: abstract and dataset descriptions on pp. 1–2; Fig. 1 and caption on p. 3; benchmark Results and competing interests on p. 20. The Fig. 1 page was visually inspected. Publisher HTML metadata and abstract also checked. Supplements, source-data files, code and clinical records were not independently audited. No publisher figure reproduced.
01What does the largest number count?
- What was observed
- About 1.77 million microscope images were used for pretraining.
- Where the conclusion stops
- Images may share treatments, plates and laboratories; they are not patients.
Source 1 · Primary PDF p. 1; abstract
02What does the 31–37% result compare?
- What was observed
- Site-averaged retrieval precision for DINO and DINOv2 against CellProfiler on EU-OPENSCREEN Bioactives.
- Where the conclusion stops
- It is not a patient-level success rate or a percentage-point change.
Source 1 · Primary PDF p. 1; abstract
Numbers you can inspect
| Measure | Value & unit | Origin & method |
|---|---|---|
| Training compounds | 119876 compounds | Reported Unannotated chemical perturbations used for pretraining. Source 1 · PDF p. 1; abstract |
| Training images | 1770000 images, approximately | Reported Images across seven laboratories; not independent patients. Source 1 · PDF p. 1; abstract |
| Training laboratories | 7 laboratories | Reported Laboratories contributing to the JUMP–CP training data. Source 1 · PDF p. 1; abstract |
| Held-out benchmark | 302 annotated compounds | Reported JUMP–Target2 retrieval comparison. Source 1 · PDF pp. 1 and 3; abstract and Fig. 1 |
| External benchmark | 2464 compounds | Reported EU-OPENSCREEN Bioactives benchmark. Source 1 · PDF p. 1; abstract |
Compare the actual experiments
These studies answer different questions. Read the unit and endpoint before comparing results.
| Study | Unit & setting | Readout | Interpretation boundary |
|---|---|---|---|
| Pretraining and held-out retrieval Source 1 · PDF pp. 1 and 3 | Cell Painting images and compounds | Similarity ranking against annotated compound profiles | Image counts and compound counts are not people. |
| External mechanism retrieval Source 1 · PDF p. 1; abstract | EU-OPENSCREEN Bioactives across sites | Site-averaged mean average precision | A ranking score does not establish a treatment effect. |
The export includes claims, available numbers, methods and source locations. It contains our reading notes and published summaries; it is not raw participant data or an independent reanalysis.
Evidence update · 31 Oct 2026
First publication. Reported observations, arithmetic and proposed follow-up questions are separated. No raw-data reanalysis. AI source check; no human editorial or clinical review.
Four questions to ask of an image model
| Reading question | Evidence to retain | What remains open |
|---|---|---|
| What was counted? | Compounds, microscope images and laboratories have different units | How dependent images are within each laboratory |
| What was held out? | Annotated compounds and an entirely held-out source | Whether an unseen site behaves like the benchmark |
| What is the score? | Ranking of profiles with related experimental labels | Whether any treatment helps a patient |
| Who evaluated it? | Authors disclose their employer and interests | Independent replication in a new setting |
Original Press-News reading framework. Follow-up questions are our interpretation, not experiments performed by the authors.
Your questions, answered
Does label-free learning mean the cells were unstained?
No. The learning step did not require treatment labels; Cell Painting still uses fluorescent stains to reveal structures.
Were 1.77 million patients studied?
No. Approximately 1.77 million is the reported number of training images.
Is a 31–37% gain a clinical success rate?
No. It is the reported improvement in a particular site-averaged retrieval metric against the stated comparator.
Can an image prove how a compound works?
A similarity can suggest a follow-up question. Establishing a mechanism requires additional experiments.
Limits of this interpretation
- Retrieval of known experimental labels is different from demonstrating clinical benefit or establishing a molecular mechanism.
- The reported advantage depends on datasets, metrics and analysis choices; results may change on other screens.
- The authors report employment and financial interests in Johnson & Johnson; the stated conflict is part of the source context.
- We did not independently rerun the code, inspect raw images or audit supplementary data.
Sources & transparency
- Abdelmoula, Albuquerque, Jaensch et al. (2026): Advancing morphological profiling with self-supervised learning through comparative insights into representation learning of cellular perturbations
Selected primary paper: abstract and dataset descriptions on pp. 1–2; Fig. 1 and caption on p. 3; benchmark Results and competing interests on p. 20. The Fig. 1 page was visually inspected. Publisher HTML metadata and abstract also checked. Supplements, source-data files, code and clinical records were not independently audited. No publisher figure reproduced. · Accessed 31 Oct 2026
DOI: 10.1038/s41592-026-03270-z
Prepared and source-checked with AI. Press-news Team is the collective publication byline, not a medical reviewer. No human editorial or clinical review has taken place. This educational article examines research methods and laboratory or observational findings, not individual diagnosis or treatment. We did not conduct these experiments or reanalyse raw data. Reported results, our interpretation and proposed future tests are separated. Source-access limits are recorded below. Photographs are illustrative.
Source check: AI source check — selected primary PDF results, captions and study boundaries
Clinical review: Not applicable to this educational guide
Suggest a correction