A still image can show where a cell structure is. To learn how it moves, researchers need a sequence of images—and enough chemical information to know what they are watching. A new approach combines both aims in living cells.
- The reported rate is 19.2 reconstructed three-dimensional volumes per second in single-wavenumber mode.
- A single-colour tracking mode and a multi-wavenumber chemical mode answer different questions.
- A short laboratory demonstration does not establish a diagnostic device or long-term imaging safety.
- Paper date
- 30 October 2026
- Material
- Living cultured cells
- Focus
- Speed, chemical contrast and the limits of a three-dimensional image
Original publication: 30 Oct 2026 · The date above refers to this brief.
From a signal to a biological claim
Measure
Record the selected contrast, sample and imaging rate.
Reconstruct
Check the depth information and the resolution trade-off.
Interpret
Ask which movement or chemical identity is directly supported.
What is new
Fukushima and colleagues combine mid-infrared photothermal imaging with optical diffraction tomography. The system reconstructs three-dimensional chemical contrast without adding a fluorescent label. In one demonstration, the authors follow lipid droplets in cultured COS-7 cells and study how their movement changes in three dimensions.
Source 1 ↗One number, two modes
The paper reports 19.2 reconstructed volumes per second, corresponding to about 52 milliseconds per volume. That is the acquisition rate in the video-rate single-wavenumber mode. A separate mode sweeps across infrared wavenumbers to gather chemical spectral information. It should not be read as a complete multi-colour chemical spectrum captured at every one of those 19.2 time points.
Source 1 ↗Why three dimensions can change an interpretation
A moving particle can travel toward or away from the observer as well as across the image. A two-dimensional projection hides that third component. The authors use a roughly 3.6-second recording to examine lipid-droplet trajectories; it is an informative short observation, not a record of every droplet throughout a cell’s lifetime.
Source 1 ↗Speed is not the same thing as resolution
Our reading checklist keeps acquisition rate, spatial resolution, field of view and chemical specificity in separate columns. Faster sampling can reveal more about motion while still missing structures smaller than the system can resolve. A contrast at one infrared wavenumber is also not a unique identification of every molecule contributing to the signal.
The authors compare their speed with earlier implementations of the same broad microscopy approach. That comparison does not mean this instrument is hundreds of times faster than every form of live-cell microscopy.
What has been demonstrated?
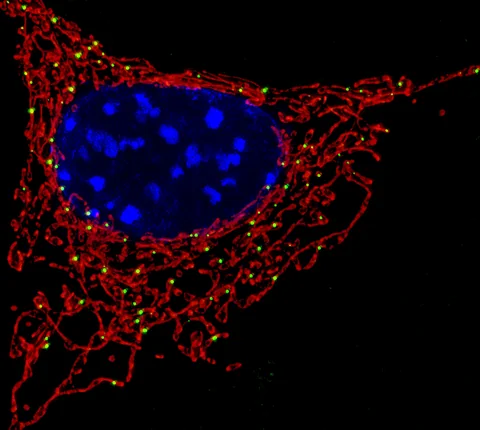
The Fig. 2 caption reports imaging of more than 30 cells from more than 10 independent cultures with similar results. That number supports the imaging demonstration; it is not a sample of patients or a measure of diagnostic accuracy. The photographed mitochondria used by Press-News are an illustrative fluorescence image, not a result from this infrared study.
Source 1 ↗The next useful comparison
An informative follow-up would compare longer observations and different cell types while reporting the same trade-offs between acquisition speed, signal quality and possible effects on the specimen. Those are our suggested checks, not extra experiments we performed.
Our earlier nuclear-pore guide also examines how a three-dimensional image is reconstructed from measurements. The systems differ, but the reading lesson carries across: identify what is measured, how the image is assembled and which biological claim would need a separate test.
The rate belongs to a particular imaging mode
Selected published primary PDF: imaging method and acquisition modes on p.2, Fig. 2 and caption on p.4, lipid-droplet tracking Results and Fig. 4. Fig. 2 and caption visually inspected. Publisher HTML metadata and abstract also checked. Supplements, source-data files, code and clinical records were not independently audited. No publisher figure reproduced.
01What does 19.2 measure?
- What was observed
- Reconstructed volumes per second in the video-rate imaging mode.
- Where the conclusion stops
- A full spectrum requires the separate multi-wavenumber sweep.
Source 1 · Published PDF pp.1–2; acquisition modes
02How broadly was the image demonstration repeated?
- What was observed
- Fig. 2 reports more than 30 cells from more than 10 independent cultures.
- Where the conclusion stops
- Cultured-cell replication is not an assessment of clinical performance.
Source 1 · Published PDF p.4; Fig. 2 caption
Numbers you can inspect
| Measure | Value & unit | Origin & method |
|---|---|---|
| Video-rate acquisition | 19.2 volumes per second | Reported Single-wavenumber volumetric mode. Source 1 · PDF pp.1–2; acquisition modes |
| Time per volume | 52 milliseconds, approximately | Reported Rounded value reported for the acquisition timing. Source 1 · PDF p.2; system Results |
| Visible illumination angles | 11 angles | Reported Number selected for the reported speed and image-quality trade-off. Source 1 · PDF p.2; system Results |
| Tracking window | 3.6 seconds, approximately | Reported Approximate duration of the highlighted lipid-droplet recording. Source 1 · PDF tracking Results; Fig. 4 caption |
Compare the actual experiments
These studies answer different questions. Read the unit and endpoint before comparing results.
| Study | Unit & setting | Readout | Interpretation boundary |
|---|---|---|---|
| Imaging-system validation Source 1 · PDF p.4; Fig. 2 | Cultured cells from independent cultures | Volumetric contrast and spatial-resolution assessment | Instrument performance in cells is not diagnostic accuracy. |
| Lipid-droplet tracking Source 1 · PDF lipid-droplet tracking Results; Fig. 4 | Living cultured COS-7 cell | Three-dimensional movement over a short recording | A short trajectory is not the complete behaviour of every droplet. |
The export includes claims, available numbers, methods and source locations. It contains our reading notes and published summaries; it is not raw participant data or an independent reanalysis.
Evidence update · 30 Oct 2026
First publication. Reported observations, arithmetic and proposed follow-up questions are separated. No raw-data reanalysis. AI source check; no human editorial or clinical review.
Four questions behind a faster microscope
| Reading question | Evidence to retain | What remains open |
|---|---|---|
| What is the time unit? | Volumes per second and acquisition mode | Whether the full chemical spectrum is collected at each time point |
| What can be resolved? | Lateral and axial resolution in the tested sample | Details below the instrument’s resolving power |
| What is the contrast? | Infrared signal at the chosen wavenumber | A unique molecular identity for every signal |
| What is the biological sample? | Culture type, observation time and independent cultures | Performance across different tissues or in patients |
Original Press-News reading framework. Follow-up questions are our interpretation, not experiments performed by the authors.
Your questions, answered
Does label-free mean nothing is applied to the cell?
No. The method uses light to generate and measure a signal; label-free means no fluorescent label is required.
Does 19.2 volumes per second mean 19.2 full spectra per second?
No. The tracking and multi-wavenumber spectral modes have different acquisition goals.
Did the study follow a patient’s cells?
The highlighted demonstration uses cultured cells; it is not a patient diagnostic study.
Could this eventually help biomedical research?
It may help researchers study dynamic cellular structures, but broader validation is needed before any particular application can be assessed.
Limits of this interpretation
- The lipid-droplet example is a short observation in cultured cells, not evidence of a clinical application.
- Temporal rate, spatial resolution and chemical specificity are different performance measures.
- Label-free imaging is not automatically free of measurement effects or photothermal exposure.
- Raw image stacks, analysis code and long-term biological effects were not independently audited.
Sources & transparency
- Fukushima, Toda, Sugawara et al. (2026): Video-rate volumetric chemical imaging via mid-infrared photothermal optical diffraction tomography
Selected published primary PDF: imaging method and acquisition modes on p.2, Fig. 2 and caption on p.4, lipid-droplet tracking Results and Fig. 4. Fig. 2 and caption visually inspected. Publisher HTML metadata and abstract also checked. Supplements, source-data files, code and clinical records were not independently audited. No publisher figure reproduced. · Accessed 30 Oct 2026
DOI: 10.1038/s41467-026-78699-z
Prepared and source-checked with AI. Press-news Team is the collective publication byline, not a medical reviewer. No human editorial or clinical review has taken place. This educational article examines research methods and laboratory or observational findings, not individual diagnosis or treatment. We did not conduct these experiments or reanalyse raw data. Reported results, our interpretation and proposed future tests are separated. Source-access limits are recorded below. Photographs are illustrative.
Source check: AI source check — selected primary PDF results, captions and study boundaries
Clinical review: Not applicable to this educational guide
Suggest a correction