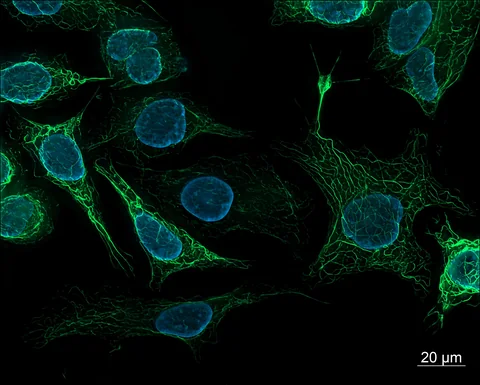
New techniques can reveal biological detail that earlier measurements missed. But a detailed map and a causal explanation are different achievements. Four recent papers provide a useful route through the questions that separate them.
- Location, identity, timing and function require different evidence.
- Several assays help most when they address different weaknesses.
- A proposed mechanism should identify an observation that could challenge it.
- Format
- Original guide linking four 2026 papers
- Goal
- Read the path from map to mechanism
- Comparison
- Conceptual; no data pooled
- Next step
- A specific prediction and discriminating test
Give each measurement one clear job
PRADA records molecular neighborhoods. The bacterial lipid study combines location and molecular tracking. The gingival atlas adds tissue context, and the cell-polarity report includes dynamic perturbations. Their methods answer different questions even when their images are equally striking.
Our framework keeps four jobs separate: identifying a signal, locating it, following it through time and changing a proposed cause. A paper can be strong at one job without having completed all four. That is a guide to what to read next, not a reason to dismiss a useful map.
Source 1 ↗Source 2 ↗Source 3 ↗Source 4 ↗First ask whether the signal is what it seems
A bright region invites a name, but a label needs an identity check. Ask how the signal is generated, what background looks like and which independent measurement supports the interpretation. For a computed cell cluster, ask which measured features define it and whether the grouping is stable.
This is also a useful way to read visually persuasive reporting. A photograph of a signal can show the observation clearly without explaining every alternative cause. The figure legend and controls should help a reader reconstruct how the researchers moved from the signal to the named biological feature.
Then ask whether the relationship is spatial or causal
Two signals can occur near each other because they interact, because both respond to another process or because of how the sample was prepared. Location narrows a hypothesis; it does not select the final explanation on its own.
Our proposed next question is: what change would distinguish these possibilities? The most useful test may be a targeted perturbation, a different measurement method or a control that removes the suspected artifact. Choosing that test requires an explicit alternative explanation, not simply repeating the attractive image at higher resolution.
Timing can constrain an explanation
When one event reliably precedes another, the order can rule out some stories. It still leaves room for a common trigger or a hidden intermediate step. A time course is therefore more informative when the measurement can detect the predicted event and the sampling interval is appropriate.
For an invented scenario, a signal appearing after a structural change cannot by itself show that it initiated that change. But a signal appearing before it does not automatically prove initiation either. That distinction keeps chronological language from silently becoming causal language.
Make the mechanism risk a clear failure
Write down a prediction and the result that would count against it. Then ask whether the chosen test distinguishes the proposal from another plausible route. A model that can explain every possible outcome after the fact offers little help in choosing an experiment.
This is where the connected papers become useful reading practice. Trace one claim through its source notes, identify the supporting measurement and record the missing check in the study notebook. The hope is more precise explanations and better-targeted research. A map’s clinical application requires a separate assessment of the intended use.
The useful disagreement is about what evidence is doing
Our comparison deliberately keeps four kinds of evidence apart. A neighbourhood map nominates possible partners. A sequence of events constrains order. A controlled intervention tests whether changing one feature changes another. Repeating the result in a meaningfully different preparation tests a boundary of the explanation.
This helps a reader ask a sharper question than whether a paper contains a beautiful atlas: which link in the proposed explanation is directly observed, which is experimentally challenged, and which is still a prediction? The matrix below records the measured objects. It does not add their results together or treat the studies as replications of one hypothesis.
Four maps, four different routes towards an explanation
This comparison uses primary abstracts and the access limits listed per source. PRADA main text is behind subscription access. Naming a reported experiment does not mean that its controls, raw files or full methods were independently audited.
01Does a proximity label prove direct interaction?
- What was observed
- PRADA reports local protein/RNA labelling and RNA-structure mapping in living systems.
- Where the conclusion stops
- A molecule in the labelled neighbourhood need not bind the bait directly. Assess labelling chemistry, timing and background before treating a neighbourhood as a binding network.
Source 1 · Abstract; Figure 2 and Figure 4 headings
02Does an earlier event explain a later event?
- What was observed
- The chlamydial study reports lipid release from nucleoids before DNA decondensation, using imaging and chemical tracking.
- Where the conclusion stops
- Temporal order narrows hypotheses. A shared developmental trigger could still account for both observations; necessity or sufficiency needs a specific intervention.
Source 2 · Abstract
03Is the gingival atlas merely observational?
- What was observed
- The primary abstract reports PITX2-directed intervention alongside the SAA1-positive tissue map.
- Where the conclusion stops
- This goes beyond co-location. Experimental specificity and transfer still depend on controls that we have not independently audited; unchecked does not mean absent.
Source 3 · Indexed primary abstract
04What adds causal leverage to a polarity map?
- What was observed
- The Ras/PIP5K abstract reports optogenetic perturbation, screening and single-molecule tracking across several model systems.
- Where the conclusion stops
- Changing a candidate process is a stronger test than observing its location alone. Whether the effect is specific and reproducible requires the detailed experiments, not this abstract-based matrix.
Source 4 · Indexed primary abstract
Compare the actual experiments
These studies answer different questions. Read the unit and endpoint before comparing results.
| Study | Unit & setting | Readout | Interpretation boundary |
|---|---|---|---|
| PRADA molecular neighbourhoods Source 1 · Abstract; Figure 2/4 headings | Living systems; labelled biomolecules | Proximity-based protein/RNA signals and RNA structure | Proximity is not direct binding. Main-text methods remain outside our access scope. |
| Chlamydial lipid/nucleoid transitions Source 2 · Abstract | Bacterial developmental stages in infected-cell experiments | Spatial lipid identity and timing relative to DNA changes | Stage ordering alone does not prove which event causes the other. |
| Gingival inflammatory neighbourhood Source 3 · Indexed abstract | Human gingival tissue and matched plaque; reported experimental follow-up | SAA1-positive epithelial state and PITX2-linked changes | A mapped human tissue state and an experimental perturbation carry different inferential scopes. |
| Ras/PIP5K polarity Source 4 · Indexed abstract | Amoebae, leukocytes, cancer cells and 3D organoids | Dynamic localization, perturbation and molecule tracking | Several model systems test a proposed mechanism; they do not establish a patient-treatment effect. |
The export includes claims, available numbers, methods and source locations. It contains our reading notes and published summaries; it is not raw participant data or an independent reanalysis.
Evidence update · 2 Oct 2026
Added a study-specific matrix separating proximity, temporal order and reported perturbation. The comparisons preserve access limits and do not score unexamined controls as missing. AI source check; no human editorial or clinical review.
A route from observation to explanation
| What you see | What it can tell you | What to ask next |
|---|---|---|
| Identity | What produces the measured signal? | Can an independent method check it? |
| Location | Where is the feature relative to its context? | What does proximity leave unresolved? |
| Time | Which measured change comes first? | Could a common trigger explain the order? |
| Perturbation | What happens after a specified change? | Is the effect specific to the proposed route? |
| Transfer | Where else does the prediction hold? | Which boundary conditions change the result? |
Our original reading framework. Questions and proposed checks are not reported experimental results.
Your questions, answered
Does using several methods prove the mechanism?
Not automatically. Their questions and weaknesses matter. Several methods that share one artifact can agree without resolving it.
What is the most useful question under a colorful figure?
What exact claim does this measurement support, and which alternative explanation would produce a similar picture?
Can a map still be useful without a complete mechanism?
Yes. It can reveal context, identify candidates and guide a discriminating experiment. Its value does not require an immediate clinical application.
How should I link this to another paper?
State the shared question or measurement principle, then state the different system and outcome. Avoid presenting a methodological parallel as direct confirmation of one biological mechanism.
Limits of this interpretation
- A selective conceptual comparison, not a systematic review or pooled analysis.
- Detailed methods were not equally accessible for every source; access notes are retained.
- Our proposed follow-up tests are questions for future research, not experiments we performed.
Sources & transparency
- Liu, Han, Wang et al. (2026): Multiomic proximity labeling in vivo by D-amino-acid-activated peroxidase reaction
Public publisher abstract, figure headings, selected extended-data captions and data/code-availability statements checked. Main article is subscription content and was not fully read. Methods, raw datasets and code not independently assessed. · Accessed 2 Oct 2026
DOI: 10.1038/s41589-026-02336-5 - Rühling, Wagner, Epprecht et al. (2026): Sphingolipids associate with the chlamydial nucleoid and mark developmental transitions in Chlamydia trachomatis
Primary abstract checked in current publisher HTML: expansion microscopy, metabolic tracking, lipidomics and the reported temporal sequence. Raw images, spectra and perturbation experiments not independently assessed; no clinical treatment evaluation. · Accessed 2 Oct 2026
DOI: 10.1038/s41467-026-77974-3 - Wu, Su, Zhang et al. (2026): Spatially resolved single cell atlas deciphers SAA1 inflammatory epithelial cells
Publisher-indexed primary abstract and publication details checked in this update; earlier selected results and discussion were checked. Raw sequencing, subject metadata and supplementary experiments not independently assessed. No patient-treatment evaluation. · Accessed 2 Oct 2026
DOI: 10.1038/s41368-026-00464-1 - Deng, Banerjee, Matsuoka et al. (2026): PIP5K-Ras bistability triggers plasma membrane symmetry breaking to define cellular polarity and regulate migration
Publisher-indexed primary abstract checked: study systems, dynamic localization, optogenetic perturbation, RasGEF screening and single-molecule tracking. Accepted article subject to final edits. Detailed protocols, simulations and movies not independently assessed. · Accessed 2 Oct 2026
DOI: 10.1038/s41467-026-77894-2
Prepared and source-checked with AI; source access recorded on 2026-09-30 (UTC). Press-news Team is our collective publication byline, not a medical reviewer. No human editorial or clinical review has taken place. We did not conduct these experiments or reanalyse their raw data. Reported findings, our explanations and proposed follow-up tests are distinguished. Access limits appear with each source. This is an educational account of basic research and research methods, not an individual diagnosis or treatment recommendation. Photographs are illustrative. Evidence notes added by AI from the access scope stated below. Calculated values use the printed arithmetic; published point estimates are not an independent reanalysis. No human editorial or clinical review.
Source check: AI source check — linked primary passages, denominator notes and deterministic arithmetic
Clinical review: Not applicable to this educational guide
Suggest a correction