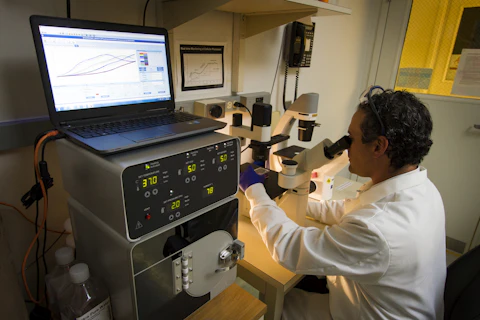
Traffic between a cell’s nucleus and its surroundings passes through a remarkably selective gateway. A new live-cell study maps the flexible proteins around that gateway while making an important distinction between a spatial distribution and a molecular movie.
- The study maps labelled protein termini, not every point along each flexible chain.
- An independent 3D method checks important features of a reconstruction from 2D measurements.
- Preferred routes and locations do not mean every molecule follows a fixed track.
- Paper date
- 22 October 2026
- System
- Live HeLa cells under standard culture conditions
- Focus
- Measurement, reconstruction and transport geometry
Original publication: 22 Oct 2026 · The date above refers to this brief.
Read the reconstruction in three layers
Measure
Locate the labelled ends and record the live-cell context.
Reconstruct
Identify assumptions and independent measurement checks.
Challenge
Ask which selective perturbation would change the predicted route.
A layered picture of a selective gateway
Yu and colleagues examine all eleven mammalian FG nucleoporins, proteins whose flexible regions contribute to selective nuclear transport. Their reconstruction places five centrally anchored members around a relatively sparse axial corridor and six asymmetrically positioned members in more extended regions at the pore’s faces.
Source 1 ↗How the map is made
The researchers track fluorescent labels at high speed in two dimensions and transform the projected localisations into three-dimensional distributions. The method uses the pore’s rotational organisation. Monte Carlo simulations and independent live-cell MINFLUX measurements provide checks on the reconstruction. The second instrument is valuable because it obtains three-dimensional localisations through a different measurement route.
Source 1 ↗Three boundaries that prevent an overclaim
First, a terminal label reports the location of a labelled end of a protein. It does not trace the whole flexible segment between that end and its anchor. Second, the reconstructed landscapes summarise where labels spend time. They are not instantaneous structures or direct measurements of every transition. Third, all measurements were made in HeLa cells under standard conditions; other cell types or stressed cells may differ.
Source 1 ↗The transport comparison adds a functional question
In the same live-cell system, the authors compare transport routes. Small passively diffusing molecules preferentially use a relatively FG-poor central route, while receptor-mediated transport favours peripheral FG-rich regions. This alignment connects the spatial map to function, but it does not establish a rigid lane for every cargo.
Source 1 ↗What would distinguish a map from a mechanism?
Our suggested follow-up asks whether a controlled change in one region shifts the predicted route while preserving unrelated features of the pore. A selective route change would challenge the model more directly than another attractive spatial reconstruction. We have not performed that perturbation or reanalysed the trajectories.
The paper discusses open and closed configurations for particular nucleoporins. Its limitations explain that these are inferred from distributions and statistical separation, rather than trapped states independently visualised after a defined perturbation. Keeping that distinction visible protects an interesting model from becoming an unsupported mechanical certainty.
How to connect this to other cellular maps
Our earlier guide to biological maps asks when a location becomes an explanation. The DNA-repair study in this collection supplies a complementary example: deliberately separating assembly from chemistry can test a proposed mechanism. These experiments concern different systems, but together they offer a useful reading habit—identify the measured object, the reconstruction step and the perturbation that could falsify the explanation.
The future value is a testable account of selective transport across more biological contexts. Disease relevance remains a research direction here, not a new diagnostic test or treatment claim.
A localisation is not a complete molecular contour
Selected accepted primary PDF: labelling and mapping Results on pp.2–4, independent MINFLUX comparison, transport-route Results and methodological limitations on pp.18–19. Mapping Results on p.4 visually inspected. Publisher HTML metadata and abstract also checked. Supplements, source-data files, code and clinical records were not independently audited. No publisher figure reproduced. The accepted version may receive further edits.
01What is the measured object?
- What was observed
- Labels at selected FG-nucleoporin termini in live HeLa cells.
- Where the conclusion stops
- The full chain and its complete spatial occupancy are not directly mapped.
Source 1 · PDF pp.2–4; methodological limitations pp.18–19
02What connects architecture with transport?
- What was observed
- Separate route measurements in the same live-cell system align transport preferences with FG-rich and FG-poor regions.
- Where the conclusion stops
- Alignment supports a model; it does not force every cargo into a fixed route.
Source 1 · PDF transport-route Results; limitations pp.18–19
Numbers you can inspect
| Measure | Value & unit | Origin & method |
|---|---|---|
| FG nucleoporins examined | 11 protein types | Reported Mammalian FG-Nup set mapped using terminal labels. Source 1 · PDF p.1; mapping Results |
| Centrally anchored group | 5 protein types | Reported Structural grouping, not five individual molecules per pore. Source 1 · PDF p.1; architecture Results |
| Asymmetrically positioned group | 6 protein types | Reported Structural grouping, not a cargo count. Source 1 · PDF p.1; architecture Results |
Compare the actual experiments
These studies answer different questions. Read the unit and endpoint before comparing results.
| Study | Unit & setting | Readout | Interpretation boundary |
|---|---|---|---|
| SPEED-based reconstruction Source 1 · PDF pp.2–4; mapping Results | Terminal localisations in living HeLa cells | Reconstructed spatial probability landscapes | Rotational organisation and labelling assumptions matter. |
| Independent 3D comparison and route mapping Source 1 · PDF MINFLUX and transport Results; limitations pp.18–19 | MINFLUX localisations and transport measurements | Cross-method architectural agreement and route preferences | Checks support the model without resolving the complete chain or every cell type. |
The export includes claims, available numbers, methods and source locations. It contains our reading notes and published summaries; it is not raw participant data or an independent reanalysis.
Evidence update · 23 Oct 2026
First publication. Observations, our arithmetic and proposed follow-up questions are separated. No raw-data reanalysis. AI source check; no human editorial or clinical review.
What kind of image is this?
| Reading question | Evidence to retain | What remains open |
|---|---|---|
| What is labelled? | A protein terminus and its anchor context | The position of intervening flexible segments |
| What is reconstructed? | A preferred spatial distribution over observations | An instantaneous molecular structure |
| What checks the reconstruction? | Simulations and independent 3D MINFLUX measurements | Agreement for every state and biological context |
| What links shape to function? | Transport-route measurements in the same system | A selective causal test of the proposed geometry |
Original Press-News assessment framework. Follow-up questions are our interpretation, not additional experiments performed by the authors.
Your questions, answered
Did researchers image every part of all eleven proteins?
No. The labels report selected terminal regions; full flexible-chain contours are not directly resolved.
Is this a film of pores opening and closing?
No. The maps are time-averaged spatial distributions; inferred states do not directly reveal all transition kinetics.
Why is MINFLUX useful here?
It offers independent three-dimensional localisations to compare with the transformed two-dimensional measurements.
Does the same architecture apply to every human cell?
The study used HeLa cells under standard conditions. Broader conservation requires measurements in other biological contexts.
Limits of this interpretation
- Terminal labelling does not reveal the entire flexible protein contour.
- Time-averaged spatial distributions are not instantaneous structures or transition kinetics.
- Tagging and transient expression may have subtle local effects despite global checks.
- Generalisability beyond HeLa cells and standard culture remains unresolved.
Sources & transparency
- Yu, Kelich, Yu et al. (2026): Live-cell 3D mapping reveals the organized architecture of FG-nucleoporins within the nuclear pore complex
Selected accepted primary PDF: labelling and mapping Results on pp.2–4, independent MINFLUX comparison, transport-route Results and methodological limitations on pp.18–19. Mapping Results on p.4 visually inspected. Publisher HTML metadata and abstract also checked. Supplements, source-data files, code and clinical records were not independently audited. No publisher figure reproduced. The accepted version may receive further edits. · Accessed 23 Oct 2026
DOI: 10.1038/s41467-026-78936-5
Prepared and source-checked with AI. Press-news Team is the collective publication byline, not a medical reviewer. No human editorial or clinical review has taken place. This educational article examines research methods and laboratory findings, not individual diagnosis or treatment. We did not conduct these experiments or reanalyse raw data. Reported results, our interpretation and proposed future tests are separated. Source-access limits are recorded below. Photographs are illustrative.
Source check: AI source check — selected primary PDF results, captions and study boundaries
Clinical review: Not applicable to this educational guide
Suggest a correction