A device can produce distinct-looking signals in a controlled chamber and still be far from a reliable health test. A new optics paper shows why the sample and the validation method matter.
- The study used prepared gas mixtures and an ambient control; the five disease-linked mixtures were not samples of human breath.
- A trajectory-aware rule assigned 14 of 19 runs correctly when evaluated on the same data, but 10 of 19 with leave-one-run-out validation.
- The reported held-out estimate is uncertain and does not measure diagnostic accuracy in patients.
- Paper date
- 6 November 2026
- Sample
- 19 laboratory runs
- Question
- Can the recorded patterns be classified?
Original publication: 6 Nov 2026 · The date above refers to this brief.
The evaluation method changes the reported result
correctly assigned runs (%)
From a signal to a health claim
Prepare
The experiment used labelled mixtures and an ambient control.
Measure
A laser setup recorded intensity and beam-position signals.
Validate
Holding out a run changed the classification result; testing real people remains a separate step.
A promising idea, a deliberately limited sample
The authors tested whether simple optical measurements could distinguish prepared gas mixtures chosen to mimic some compounds associated with breath. The seven classes comprised five disease-linked surrogate mixtures, one healthy-air surrogate and an ambient control. None should be confused with a collected breath sample from a person.
Source 1 ↗What did the instrument actually record?
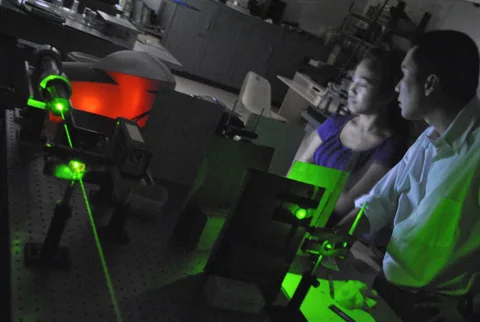
The apparatus recorded a light-intensity signal and two coordinates describing the position of a beam. These are instrument channels. A characteristic pattern in them is not automatically a measurement of an individual metabolite, much less evidence of a diagnosis.
Source 1 ↗The result changes when a run is held out
For the same trajectory-aware classification rule, the authors report 14 correct assignments out of 19 runs when scored using the same runs used to construct the class templates: 73.7%. When each run was excluded from its own template, the reported result was 10 of 19, or 52.6%. The 21.1 percentage-point difference is our subtraction of the rounded percentages. These are two evaluations of the same small dataset, not separate patient trials.
Source 1 ↗Why the signal is difficult to interpret
The authors found that changes in chamber pressure and mixture concentration rose together. Beam-position changes were dominated by a common pressure-related optical effect. The experiment therefore cannot cleanly separate the contribution of chemistry from the pressure and flow conditions that accompanied each mixture.
Source 1 ↗What would move the idea forward?
The authors propose separating those influences in future experiments. Beyond that laboratory question, a screening claim would require a separate study in real breath samples, with appropriate reference diagnoses, unseen participants and a clearly reported evaluation plan. None of those clinical results is established here.
Source 1 ↗A comparison worth keeping
Our guide to fibre-optic rotation measurements makes a similar distinction: an instrument can measure something precisely in a controlled setup without having demonstrated clinical performance. The relevant next question is always which sample was tested and what a correct answer would mean outside that setup.
The patient sample that was not there
Primary PDF: abstract p. 1, design and run inventory, Fig. 5 and its caption, validation results and Discussion. The abstract page was visually inspected. Publisher metadata and abstract also checked. Supplements, source-data files, code and clinical records were not independently audited. No publisher figure reproduced.
01Were the disease-linked samples patient breath?
- What was observed
- Five disease-linked classes were prepared surrogate mixtures; the other classes were a healthy-air surrogate and ambient control.
- Where the conclusion stops
- The paper does not provide clinical screening accuracy for people.
Source 1 · Primary PDF abstract, design and Discussion
02How did the reported result change when runs were held out?
- What was observed
- For the trajectory-aware rule, 14/19 runs were correct on resubstitution and 10/19 with leave-one-run-out.
- Where the conclusion stops
- The same 19 runs underpin both estimates, and the held-out estimate is imprecise.
Source 1 · Primary PDF abstract, Fig. 5 and validation Results
Numbers you can inspect
| Measure | Value & unit | Origin & method |
|---|---|---|
| Laboratory runs | 19 runs | Reported Total runs, not people. Source 1 · Primary PDF design |
| Surrogate and control classes | 7 classes | Reported Five disease-linked mixtures, one healthy-air surrogate and ambient control. Source 1 · Primary PDF abstract |
| Same-data assignments | 14 runs | Reported Correct out of 19 under resubstitution. Source 1 · Primary PDF validation Results |
| Held-out assignments | 10 runs | Reported Correct out of 19 with leave-one-run-out. Source 1 · Primary PDF Fig. 5 |
| Difference in reported percentages | 21.1 percentage points | Calculated 73.7 minus 52.6 using reported rounded percentages; not a patient benefit. Source 1 · Primary PDF abstract |
Compare the actual experiments
These studies answer different questions. Read the unit and endpoint before comparing results.
| Study | Unit & setting | Readout | Interpretation boundary |
|---|---|---|---|
| Same-data classification Source 1 · Primary PDF validation Results | The same 19 laboratory runs | 14 correct assignments | Scoring the data used to build templates can overstate performance on new runs. |
| Leave-one-run-out classification Source 1 · Primary PDF Fig. 5 | Each held-out laboratory run | 10 correct assignments | This is still a small internal evaluation and not external patient validation. |
The export includes claims, available numbers, methods and source locations. It contains our reading notes and published summaries; it is not raw participant data or an independent reanalysis.
Evidence update · 8 Nov 2026
First publication. Reported observations, arithmetic and proposed follow-up questions are separated. No raw-data reanalysis. AI source check; no human editorial or clinical review.
Four questions before calling this a breath test
| Reading question | What the paper reports | What remains open |
|---|---|---|
| What entered the chamber? | Prepared gas mixtures and an ambient control | Real human breath contains a more complex and variable mixture |
| How many observations? | 19 runs across seven classes | Runs are not patients |
| How were predictions evaluated? | Same-data and leave-one-run-out assessments | One held-out run is not an external clinical validation |
| What drives the signal? | Optical signals included a pressure-related component | The independent chemical contribution remains unresolved |
Original Press-News reading framework. Follow-up questions are our interpretation, not experiments performed by the authors.
Your questions, answered
Did the researchers diagnose patients from breath?
No. The disease-linked classes were synthetic mixtures; this study did not establish diagnostic performance in patients.
What does 52.6% describe?
Ten correct assignments out of 19 laboratory runs in the reported leave-one-run-out evaluation of seven mixture and control classes.
Is 73.7% a second patient result?
No. It is 14 of the same 19 runs assessed by resubstitution, using the data used to form the templates.
Has the device identified individual molecules in breath?
The authors say the design does not isolate a clean per-molecule optical fingerprint. Human breath was not tested here.
Limits of this interpretation
- The five disease-linked categories are synthetic canister mixtures, not breath collected from people.
- Nineteen runs are a small dataset; the paper reports a wide 95% interval for the leave-one-run-out result.
- Pressure, concentration and aspects of the experimental procedure were entangled.
- We did not audit the code, supplementary data, source measurements or perform an independent reanalysis.
Sources & transparency
- Tatavarti, Nadimpalli and Pachiyappan (2026): Photonic elastic-backscatter fingerprinting of exhaled-breath metabolites for non-invasive disease screening
Primary PDF: abstract p. 1, design and run inventory, Fig. 5 and its caption, validation results and Discussion. The abstract page was visually inspected. Publisher metadata and abstract also checked. Supplements, source-data files, code and clinical records were not independently audited. No publisher figure reproduced. · Accessed 8 Nov 2026
DOI: 10.1038/s41598-026-79215-5
Prepared and source-checked with AI. Press-news Team is the collective publication byline, not a medical reviewer. No human editorial or clinical review has taken place. This educational article examines research methods and laboratory or observational findings, not individual diagnosis or treatment. We did not conduct these experiments or reanalyse raw data. Reported results, our interpretation and proposed future tests are separated. Source-access limits are recorded below. Photographs are illustrative.
Source check: AI source check — selected primary PDF results, captions and study boundaries
Clinical review: Not applicable to this educational guide
Suggest a correction