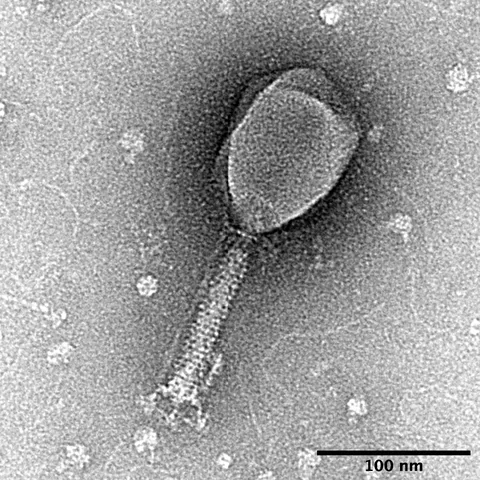
Viruses may matter to antibiotic resistance without frequently carrying resistance genes themselves. A new catalogue makes that distinction visible by analysing viral sequences and their predicted bacterial partners together.
- A viral sequence cluster is not a counted infectious particle or a cultured species.
- 9.1% describes a share of detected resistance-gene subtype diversity, not the fraction of viruses carrying resistance.
- A predicted phage–host link does not demonstrate a gene-transfer event.
- Paper date
- 23 October 2026
- Material
- Public livestock-manure metagenomes
- Focus
- Direct carriage versus ecological association
Original publication: 23 Oct 2026 · The date above refers to this brief.
A subtype repertoire, not a transfer rate
detected antibiotic-resistance gene subtypes
Keep three ecological statements separate
Catalogue
A sequence belongs to a reconstructed viral grouping.
Associate
An analysis predicts a microbial partner or gene annotation.
Demonstrate
A distinct experiment must establish the proposed biological event.
The new resource
Jiang and colleagues assemble the Livestock Manure Virus Database from 4,017 metagenomes, producing 1,330,372 viral operational taxonomic units, or vOTUs. These are sequence-based groupings defined by an analysis pipeline. They do not mean that researchers cultured more than a million distinct viruses or counted that many infectious particles.
Source 1 ↗The 9.1% headline needs its denominator
The study identifies 78 resistance-gene subtypes in the virome out of 857 subtypes detected in the broader manure resistome. Our check, 78 ÷ 857 × 100 rounded to one decimal, reproduces the reported 9.1%. It is a diversity fraction: how many types overlap. It does not measure the fraction of viral particles, genomes, gene copies or transmission events that carry resistance.
Source 1 ↗Carriage, a partner and transfer are different claims
Our reading framework separates three observations. A resistance-like sequence annotated on a viral contig supports a carriage hypothesis, subject to annotation quality and viral boundaries. A predicted connection to a resistant bacterium supports a host-association hypothesis. Demonstrating transfer would require evidence that a gene moved and produced the proposed consequence.
Combining these under one label such as “viruses spread resistance” discards the distinction the study is trying to investigate. The paper reports infrequent virus-encoded resistance genes alongside extensive predicted links to resistant hosts. That pattern motivates an ecological explanation; it does not turn every predicted link into a demonstrated transfer.
Source 1 ↗More mapped reads is useful, but it is a different benchmark
The authors evaluate viral-read recruitment in independent manure datasets, with 43 metagenomes in the Fig. 1f comparison. Better mapping shows that the catalogue captures sequence material missing from comparator resources. It does not by itself validate every host assignment, resistance annotation or estimate of health risk.
Source 1 ↗What would make the ecological explanation stronger?
Our proposed reading questions ask whether the host links recur in independent samples, whether different prediction methods agree and whether the relationship persists after accounting for sampling and bacterial abundance. A predictor’s importance in a random-forest model is not the effect of changing that predictor experimentally.
The useful future is a more testable account of how microbial communities and resistance interact. This catalogue is a resource for that work, not a direct estimate of an individual’s exposure or proof that a particular manure treatment prevents illness. Read it alongside our bacterial regulatory map: one maps ecological partners, the other maps potential gene-control relationships, and both need a separate causal test.
The same percentage can describe very different quantities
Selected accepted PDF: abstract p.1, catalogue and independent mapping Results p.2, Fig. 1 and resistance-subtype Results p.3, ecological and host-link Results. Fig. 1 and caption visually inspected. Publisher HTML metadata and abstract also checked. Supplements, source-data files, code and clinical records were not independently audited. No publisher figure reproduced. The accepted version may receive further edits.
01What is the catalogue’s unit?
- What was observed
- Sequence-defined viral operational taxonomic units reconstructed from metagenomes.
- Where the conclusion stops
- Not a count of cultured species or infectious particles.
Source 1 · PDF pp.1–3; catalogue Results and Fig. 1
02Does 9.1% quantify viral carriage frequency?
- What was observed
- It is the fraction 78/857 of detected resistance-gene subtypes.
- Where the conclusion stops
- Not the proportion of viruses carrying genes or a transfer probability.
Source 1 · PDF p.3; Virus-encoded ARGs Results
Numbers you can inspect
| Measure | Value & unit | Origin & method |
|---|---|---|
| Input metagenomes | 4017 metagenomes | Reported Catalogue input, not independent exposed people. Source 1 · PDF p.1; abstract |
| Catalogue vOTUs | 1330372 sequence-defined units | Reported Species-level sequence clustering under the study pipeline. Source 1 · PDF p.2; catalogue Results |
| Virome resistance subtypes | 78 ARG subtypes | Reported Detected subtype repertoire in viral sequence annotations. Source 1 · PDF p.3; resistance Results |
| Broader resistance repertoire | 857 ARG subtypes | Reported Denominator for subtype-diversity overlap. Source 1 · PDF p.3; resistance Results |
| Subtype-repertoire share | 9.1 percent | Calculated round(78/857*100,1); reproduces the reported diversity fraction, not carriage frequency. Source 1 · PDF p.3 counts; Press-News arithmetic |
| Independent benchmark metagenomes | 43 metagenomes | Reported Fig. 1f read-recruitment comparison, not the catalogue input count. Source 1 · PDF p.3; Fig. 1f caption |
Compare the actual experiments
These studies answer different questions. Read the unit and endpoint before comparing results.
| Study | Unit & setting | Readout | Interpretation boundary |
|---|---|---|---|
| Catalogue construction Source 1 · PDF pp.2–3; catalogue Results | Public manure metagenomes | Reconstructed viral sequence groups | Clustering and completeness differ from viability. |
| Host-link analysis Source 1 · PDF host-interaction Results | Predicted phage–microbial partners | Associations with resistant hosts | An association is not a demonstrated resistance-gene transfer. |
The export includes claims, available numbers, methods and source locations. It contains our reading notes and published summaries; it is not raw participant data or an independent reanalysis.
Evidence update · 23 Oct 2026
First publication. Observations, our arithmetic and proposed follow-up questions are separated. No raw-data reanalysis. AI source check; no human editorial or clinical review.
Four claims hidden inside a virome headline
| Reading question | Evidence to retain | What remains open |
|---|---|---|
| What was catalogued? | Pipeline-defined viral sequence clusters | Viability, complete genomes and cultured species |
| What does 9.1% count? | 78 of 857 detected resistance subtypes | Frequency of viral carriage or transfer |
| What is a host link? | Predicted virus–microbe association | Demonstrated infection, transfer or a functional effect |
| What improved in the benchmark? | Read recruitment in independent metagenomes | Accuracy of every downstream biological annotation |
Original Press-News assessment framework. Follow-up questions are our interpretation, not additional experiments performed by the authors.
Your questions, answered
Did researchers isolate 1.3 million live viruses?
No. The catalogue contains 1,330,372 sequence-defined vOTUs reconstructed from metagenomic data.
Do 9.1% of viruses carry resistance genes?
That is not what the percentage means. It is 78 of 857 detected resistance-gene subtypes.
Does a phage linked to a resistant bacterium carry its resistance genes?
Not necessarily. Host association, gene carriage and gene transfer require distinct evidence.
What makes the new database useful?
It expands livestock-manure sequence coverage and improves read recruitment in independent datasets, while making the limits of direct viral resistance carriage explicit.
Limits of this interpretation
- Metagenomic reconstruction and annotation depend on pipeline choices and reference databases.
- Sequence clusters and detected gene subtypes are different units.
- Predicted host links are not observed transfer events or infection risk estimates.
- Raw reads, supplementary annotations and prediction code were not independently reanalysed.
Sources & transparency
- Jiang, Li, Lei et al. (2026): A global livestock virome catalog links viruses with resistome assembly
Selected accepted PDF: abstract p.1, catalogue and independent mapping Results p.2, Fig. 1 and resistance-subtype Results p.3, ecological and host-link Results. Fig. 1 and caption visually inspected. Publisher HTML metadata and abstract also checked. Supplements, source-data files, code and clinical records were not independently audited. No publisher figure reproduced. The accepted version may receive further edits. · Accessed 23 Oct 2026
DOI: 10.1038/s41467-026-78855-5
Prepared and source-checked with AI. Press-news Team is the collective publication byline, not a medical reviewer. No human editorial or clinical review has taken place. This educational article examines research methods, model evaluation and laboratory or observational findings, not individual diagnosis or treatment. We did not conduct these experiments or reanalyse raw data. Reported results, our interpretation and proposed future tests are separated. Source-access limits are recorded below. Photographs are illustrative.
Source check: AI source check — selected primary PDF results, captions and study boundaries
Clinical review: Not applicable to this educational guide
Suggest a correction