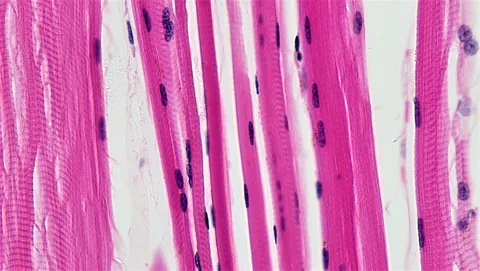
Researchers looking for genetic influences on body composition found a rare variant in MSTN, the gene for myostatin. The strongest association was with lean mass in the legs. The study also measured muscle volume and grip strength, giving readers a way to compare anatomy with physical function.
- The discovery analysis used DXA lean-mass measurements from about 79,000 people of genetically inferred European ancestry in Iceland and the UK Biobank.
- The estimated association with leg lean mass was +0.28 standard deviations (95% CI 0.19 to 0.37). In the separate grip analysis, the maximum grip estimate was +0.087 standard deviations (0.039 to 0.13).
- The lab analysis found higher measured total myostatin in carriers alongside lower bioactive myostatin relative to total. Direct tests of drug benefit and safety would require separate research.
- Paper date
- 20 November 2026
- Discovery sample
- About 79,000 people
- Study type
- Genetic association and protein measurements
Original publication: 20 Nov 2026 · The date above refers to this brief.
Follow the measure from gene to function
Find an association
Compare genetic variation with lean-mass measurements in the discovery sample.
Check other measurements
Look for consistent direction in impedance, MRI or physical performance data.
Test clinical questions separately
Design studies that directly measure benefits, harms and function.
What the scan measures
The authors compared common and rare genetic variants with lean mass in different parts of the body. DXA, a form of X-ray scanning, estimates lean tissue and is used as a proxy for muscle mass. The main analysis accounted for age, sex, height and body mass index. It found associations at 63 locations in the genome. The rare MSTN variant, p.Ile225Thr, had the largest estimated association among the reported lead variants in the DXA analysis.
Source 1 ↗A standard deviation gives the scale
The leg lean-mass estimate of +0.28 is expressed in standard deviations, a measure of how spread out the standardized outcome is. Figure 1 reports a smaller estimate of +0.087 for maximum grip strength on its own standardized scale, using a much larger UK Biobank sample. Each effect has its own measurement and denominator. The estimates describe shifts on the study’s scales and cannot be converted directly to kilograms of muscle or a percentage increase in strength.
Source 1 ↗Different measurements of body composition
The authors also looked at leg fat-free mass estimated using bioelectrical impedance and at thigh muscle volume measured by MRI. The associations pointed in the same direction. Because each method captures a different feature and can involve a different subset of people, consistent direction provides useful corroboration while leaving questions about how well the findings transfer to other groups.
Source 1 ↗Total protein and relative activity
In 395 matched carrier and control pairs, the authors reported higher measured levels of total and bioactive myostatin in carriers. Bioactive myostatin was lower when evaluated relative to total myostatin. A share can fall when its denominator grows faster than its numerator. The researchers interpret the pattern as consistent with reduced activity relative to the total available protein. Many authors reported employment at Amgen deCODE genetics during the study.
Source 1 ↗A large study can contain a very small analysis
A separate analysis pooled several uncommon variants predicted to reduce or abolish MSTN function. It identified 34 carriers overall, but only five had the scans needed for the lean and fat mass comparison. The five belong to that separate analysis. This is why the denominator for a particular result matters more than the biggest sample size in the abstract. Future studies could test functional outcomes such as mobility and characterize safety in a dedicated design.
Source 1 ↗Follow the outcome and its sample
Primary journal PDF. Checked Results, Table 1, Figure 1 and its caption, the matched protein analysis, Discussion, Methods and competing interests. Publisher metadata and abstract also checked. Supplements, source-data files, code and clinical records were not independently audited. No publisher figure reproduced.
01How much did leg lean mass and grip strength differ?
- What was observed
- The reported estimates were +0.28 SD for leg lean mass and +0.087 SD for maximum grip in different analyses.
- Where the conclusion stops
- Each value uses its own standardized outcome. The estimates cannot be compared as the same physical unit.
Source 1 · Journal Table 1 and Figure 1
02How many carriers contributed to the grouped variant scan analysis?
- What was observed
- The paper identified 34 carriers of variants predicted to reduce MSTN function. Five carriers had the required DXA data.
- Where the conclusion stops
- The outcome-specific DXA estimate uses the subset of five. This grouped variant analysis is separate from the focal p.Ile225Thr analysis.
Source 1 · Journal Figure 1 caption and Methods, gene burden analysis
Numbers you can inspect
| Measure | Value & unit | Origin & method |
|---|---|---|
| DXA discovery sample, approximately | 79000 people | Reported Main Iceland and UK Biobank lean-mass meta-analysis. Source 1 · Journal Results, first subsection |
| Genome-wide loci | 63 loci | Reported Independent regions associated with lean mass in the discovery analysis. Source 1 · Journal Abstract and Results |
| Leg lean mass | 0.28 standard deviations | Reported Estimated association for p.Ile225Thr. 95% CI 0.19 to 0.37. Source 1 · Journal Table 1 |
| Leg fat-free mass by impedance | 0.11 standard deviations | Reported Estimated association for p.Ile225Thr. 95% CI 0.06 to 0.16. Source 1 · Journal Results, first subsection |
| Thigh muscle volume by MRI | 0.23 standard deviations | Reported Estimated association for p.Ile225Thr. 95% CI 0.10 to 0.37. Source 1 · Journal Results, first subsection |
| Maximum grip | 0.087 standard deviations | Reported Estimated association for p.Ile225Thr. 95% CI 0.039 to 0.13. Source 1 · Journal Figure 1 |
| Matched protein analysis | 395 pairs | Reported Matched carrier and control pairs evaluated for circulating myostatin. Source 1 · Journal Results, bioactive-to-total myostatin |
| Carriers in grouped variant analysis | 34 people | Reported Carriers of rare variants predicted to reduce MSTN function in the separate burden analysis. Source 1 · Journal Figure 1 caption and Methods |
| Grouped analysis carriers with DXA | 5 people | Reported Outcome-specific number contributing to the lean and fat mass comparison. Source 1 · Journal Figure 1 caption and Methods |
Compare the actual experiments
These studies answer different questions. Read the unit and endpoint before comparing results.
| Study | Unit & setting | Readout | Interpretation boundary |
|---|---|---|---|
| Body composition and grip Source 1 · Journal Table 1, Figure 1 and Results | People with varying measures available | DXA, impedance, MRI and maximum grip | Sample sizes and physical outcomes vary by measurement. |
| Matched protein analysis Source 1 · Journal Results, bioactive-to-total myostatin | Carrier and control pairs | Total and bioactive myostatin | Assess absolute levels and the bioactive measure relative to total separately. |
The export includes claims, available numbers, methods and source locations. It contains our reading notes and published summaries; it is not raw participant data or an independent reanalysis.
Evidence update · 21 Nov 2026
First publication. Reported observations, arithmetic and proposed follow-up questions are separated. No raw-data reanalysis. AI source check; no human editorial or clinical review.
Four measurements of the same variant association
| Outcome | Estimate and 95% CI | What the measure captures |
|---|---|---|
| DXA leg lean mass | +0.28 SD (0.19 to 0.37) | Estimated lean tissue in the legs, adjusted for body size and other covariates. |
| Impedance leg fat-free mass | +0.11 SD (0.06 to 0.16) | A different body composition estimate in a UK Biobank subset. |
| MRI thigh muscle volume | +0.23 SD (0.10 to 0.37) | Image-based estimate of thigh muscle volume. |
| Maximum grip strength | +0.087 SD (0.039 to 0.13) | A physical performance measurement in the UK Biobank. |
Press-News summary of selected outcomes. Each effect uses the standard deviation of its own outcome.
Your questions, answered
What does a +0.28 SD estimate mean?
It represents a shift on the study’s standardized leg lean-mass scale under its genetic model. The scale depends on how that measurement varies in the analyzed data.
Did the authors measure physical function?
The paper reports an association with maximum grip strength in UK Biobank data. A grip test captures one aspect of performance.
Where does the five-carrier count come from?
It is the subset with DXA measurements in a separate analysis that grouped predicted loss-of-function variants. The focal p.Ile225Thr variant was examined separately.
How can total protein rise while its bioactive share falls?
The bioactive-to-total comparison uses total myostatin as the reference. In the matched analysis, both measured forms were higher in carriers, while bioactive myostatin was lower relative to total.
Limits of this interpretation
- The main DXA discovery sample came from people of genetically inferred European ancestry. Allele frequencies and measurement settings vary across populations.
- DXA lean mass and grip strength capture different parts of physical function. Standardized estimates use the scale of their own outcome.
- Outcome-specific samples vary and the separate predicted loss-of-function DXA analysis included only five carriers.
- The paper studies genetic associations and protein measurements. Drug dosing, clinical benefits and safety would require separate trials.
Sources & transparency
- Larusdottir, Teitsdottir, Tragante et al. (2026): Genome-wide association study identifies a functional myostatin variant increasing lean mass in humans
Primary journal PDF. Checked Results, Table 1, Figure 1 and its caption, the matched protein analysis, Discussion, Methods and competing interests. Publisher metadata and abstract also checked. Supplements, source-data files, code and clinical records were not independently audited. No publisher figure reproduced. · Accessed 21 Nov 2026
DOI: 10.1038/s41467-026-77766-9
Prepared and source-checked with AI. Press-news Team is the collective publication byline, not a medical reviewer. No human editorial or clinical review has taken place. This educational article examines published observational research. Claims and calculations are based on the sources listed below. Photographs provide context for the topic.
Source check: AI source check — selected primary results, captions and study boundaries
Clinical review: Not applicable to this educational guide
Suggest a correction