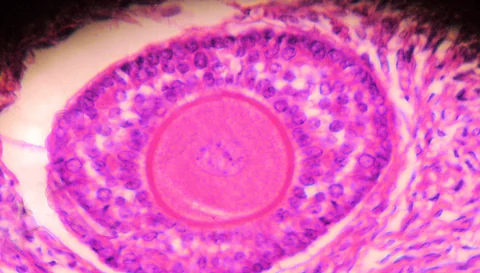
Activation does not necessarily send every egg cell through the same timetable. A mouse experiment follows a labelled cohort long enough to distinguish continued presence from the capacity to contribute to reproduction.
- Keep the initially labelled cohort separate from the pool present at a later age.
- Persistence and developmental competence require different measurements.
- A mouse mechanism supplies a research question for human work.
- Publication
- Nature Aging · 8 October 2026
- System
- Genetic lineage tracing in mice
- Chart denominator
- Initially labelled activated cohort
Original publication: 8 Oct 2026 · The date above refers to this brief.
Detectable fraction of the initial labelled mouse oocyte cohort
% of initially labelled cohort
Persistence and competence answer different questions
Identify the cohort
A lineage label links observations to an activated oocyte cohort in mice. It is not continuous filming of one individual egg cell.
Measure persistence
Count labelled cells at later time points and compare with the relevant denominator. Persistence describes how long a cohort remains detectable.
Assess competence
Functional assays ask a different question: what can the surviving cells do? Keep the assay, time point and model alongside each conclusion.
What the label revealed
Liang and colleagues labelled activated oocytes in young mice. Some remained detectable months later, and long-lived labelled cells contributed to offspring. Secondary-follicle development was heterogeneous; experiments involving FURIN and GDF9 support a mechanism regulating growth. This concerns activated cells, distinct from the dormant reserve.
Source 1 ↗The chart follows a cohort, not the whole ovary
The bars retain the paper’s denominator: the initial labelled cohort, normalized to 100%. They show mean detectable fractions at three later times. The source reports standard deviations and five mice per time point; bars do not display uncertainty intervals.
Source 1 ↗A falling fraction leaves several questions open
A smaller detectable cohort tells us that fewer labelled cells remain observable. It does not, by itself, describe every route out of that cohort. Our suggested interpretation sheet would separate continued presence, developmental progression and functional contribution.
The useful discipline is to ask which observation resolves each route. A later tissue count and a reproductive outcome occupy different columns. Neither should be substituted for the other simply because both involve the same genetic label.
Presence is the beginning of the competence question
Suppose a labelled cell remains in a tissue. A functional claim needs a suitable challenge and an outcome that shows the relevant capacity. It also needs to make clear which surviving cells were eligible for that challenge.
Our proposed reporting improvement is a flow from the original cohort to the tested subset, then to the functional result. That avoids letting a successful selected subset silently stand for every cell initially labelled. We do not calculate a fertility-success rate from the persistence percentages.
Partial rescue has a precise place in the argument
The paper reports partial rescue of follicle growth with recombinant GDF9 after FURIN disruption.
Source 1 ↗How to read that rescue
A rescue can strengthen a pathway explanation when it restores a specified output. The word partial should keep the reader asking what remains impaired and whether an alternative route could explain recovery.
Our proposed next test would retain growth, cellular integrity and functional competence as separate outcomes. Restoring one would not automatically settle the others. A useful comparison would also track whether the intervention changes the distribution of developmental times rather than only an average endpoint.
The promising question for the next study
We would ask which environmental conditions change the relationship between developmental pace and later competence, using a defined cohort and prespecified follow-up. That is our proposed experiment, not a demonstrated intervention for people.
Read this alongside the brain-atlas and laboratory-model guides: a map of age-related states and a traced lineage answer different questions. The opportunity is to explain how developmental timing works. Translating that explanation requires direct evidence in the intended species and setting; this article supplies no advice on reproductive timing or fertility treatment.
One cohort, one denominator
Printed Figure 1d means and SDs retained. Mouse counts and dispersion are not participant risk estimates; source data were not reanalysed.
01What does the chart count?
- What was observed
- Detectable cells from the initial labelled cohort.
- Where the conclusion stops
- Different from all cells present at follow-up.
Source 1 · Figure 1d caption; first Results section
02What did the rescue establish?
- What was observed
- Partial restoration of follicle growth.
- Where the conclusion stops
- Not a quantified restoration of fertility.
Source 1 · FURIN/GDF9 results; Figure 6
Numbers you can inspect
| Measure | Value & unit | Origin & method |
|---|---|---|
| At 2 months: mean | 47.97 percent of initial labelled cohort | Reported Mean; baseline normalized to 100%. Source 1 · Figure 1d; Results |
| At 6 months: mean | 15.46 percent of initial labelled cohort | Reported Mean; same denominator. Source 1 · Figure 1d; Results |
| At 12 months: mean | 4.17 percent of initial labelled cohort | Reported Mean; same denominator. Source 1 · Figure 1d; Results |
| At 2 months: SD | 11.61 percentage points | Reported Dispersion reported as SD, not CI. Source 1 · Figure 1 caption; Results |
| At 6 months: SD | 4.48 percentage points | Reported Dispersion reported as SD, not CI. Source 1 · Figure 1 caption; Results |
| At 12 months: SD | 1.11 percentage points | Reported Dispersion reported as SD, not CI. Source 1 · Figure 1 caption; Results |
| Sampling at each time point | 5 mice | Reported Mice per time point, not a continuous observation of one cell. Source 1 · Figure 1d caption |
Compare the actual experiments
These studies answer different questions. Read the unit and endpoint before comparing results.
| Study | Unit & setting | Readout | Interpretation boundary |
|---|---|---|---|
| Liang et al. 2026 · tracing Source 1 · Figure 1d | Labelled mouse cohort | Detectable persistence | Not a human fertility probability. |
| Liang et al. 2026 · perturbation Source 1 · Figure 6; FURIN/GDF9 results | Mouse follicles | Growth and partial rescue | A specified functional output. |
The export includes claims, available numbers, methods and source locations. It contains our reading notes and published summaries; it is not raw participant data or an independent reanalysis.
Evidence update · 9 Oct 2026
First publication. Printed measurements retain their denominators, source locations and dispersion labels. Calculations and proposed follow-up tests are identified. No raw experimental or participant data were reanalysed. AI source check; no human editorial or clinical review.
Three claims, three kinds of follow-up
| Question | Measurement to keep separate | Our suggested check |
|---|---|---|
| Is the cohort still detectable? | Counts relative to its own baseline | Preserve labelling and detection definitions |
| Can surviving cells perform the relevant function? | A functional test on an eligible subset | Publish the flow into that subset |
| Why does developmental timing differ? | A perturbation and a specified rescue output | Check remaining deficits and other pathways |
Our interpretation framework. The columns do not convert mouse observations into human treatment effects.
Your questions, answered
Are the chart percentages of all egg cells in the ovary?
No. The denominator is the initially labelled activated cohort.
Are SD and a confidence interval the same?
No. We preserve the source’s SD label; the bars display means without error bars.
Does partial rescue mean fertility was restored?
The cited rescue concerns follicle growth. Broader functional claims require their own measurements.
Can this extend human fertility?
This article establishes no human intervention benefit. The proposed next steps concern testing the mechanism and its boundaries.
Limits of this interpretation
- Measurements concern mice and a genetically labelled cohort.
- The chart is not a continuous recording of one cell.
- Detectable persistence does not itself estimate fertility probability.
- No human reproductive intervention is evaluated.
Sources & transparency
- Liang, Yang, Li et al. (2026): Heterogeneity in secondary follicle development buffers the lifespan of activated oocytes to optimize female fertility in mice
Publisher HTML abstract, Figure 1 and its caption/results, secondary-follicle analysis, FURIN/GDF9 perturbation results and Discussion assessed. No raw lineage counts, supplementary-data audit or human fertility evidence reviewed. Chart redraws printed means, not publisher artwork. · Accessed 9 Oct 2026
DOI: 10.1038/s43587-026-01237-5
Prepared and source-checked with AI. Press-news Team is the collective publication byline, not a medical reviewer. No human editorial or clinical review has taken place. This educational article explains methods and basic or preclinical research; it provides no individual diagnosis or treatment recommendations. We did not conduct these experiments or reanalyse raw data. Findings, our interpretation and suggested future tests are separated. Source-access limits are recorded below. Photographs are illustrative.
Source check: AI source check — specified primary passages, denominators and experimental boundaries
Clinical review: Not applicable to this educational guide
Suggest a correction