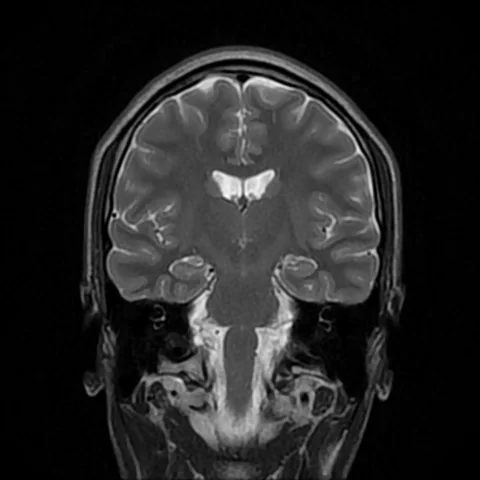
A headline about the ageing brain can sound like a forecast of your own future. A molecular atlas serves a different purpose: it gives researchers a reference against which to ask more precise questions. Reading it well starts with separating people, cells and the measurements made inside those cells.
- Research published
- Nature · 23 September 2026
- Material
- Postmortem prefrontal cortex
- Design
- Observational, across different ages
Original publication: 23 Sep 2026 · The date above refers to this brief.
Who is represented in the four discovery age groups?
Donors in each downstream analysis group
The finding in brief
Yang and colleagues profiled RNA in 1,307,674 nuclei from 284 neurotypical donors. They studied the dorsolateral prefrontal cortex, one brain region. The main pattern combined extensive developmental change, relative adult stability and renewed changes in later life, especially in glial cells. They assembled an external replication dataset of 306 donors; the matched-age validation excluded three fetal donors, as distinguished in our evidence notes below. These are molecular observations, not results of a treatment experiment.
Source 1 ↗A million measurements still need the right denominator
Imagine taking hundreds of photographs of each tree in a small wood. You gain detail about those trees; you have not surveyed hundreds of independent forests. The same reasoning matters when many cellular measurements come from the same person. A reliable analysis needs to preserve that relationship instead of treating every measurement as an unrelated participant.
For a reader, a useful note has three lines: how many donors, how many tissue samples and how many usable measurements. A fourth line records who could enter the sample. Bigger molecular datasets can reveal rare patterns, but their impressive size does not automatically establish how well they represent other people.
A lifespan pattern is not a film of one person ageing
Our reading of this design is that an age-related curve should be treated as a comparison across people. It cannot reveal exactly when a particular individual changed. Differences between age groups can reflect more than ageing alone: people may differ in exposures, life histories, tissue handling or other characteristics.
This is why a smooth curve should not become a birthday deadline. An estimated transition is a property of the sample, measurement and model. It is not evidence that everyone’s brain suddenly enters a new state on the same birthday. Likewise, relative stability in one measured feature does not mean that learning, experience or brain function has stopped changing.
How this connects to the other maps in this edition
Read this story alongside our new lipid-atlas report and the earlier article on live cellular imaging. They offer three complementary reading questions: what molecular messages are present, what chemistry occupies a location, and what changes during a recording?
Agreement between different measurements can make an explanation more plausible, but the studies do not automatically validate one another. A comparison must account for species, tissue, age and preparation. A useful future project would make more than one kind of measurement in carefully matched material and state in advance which relationships it expects. That is our proposed next step, not a result demonstrated by combining these news reports.
The opportunity: better questions before better interventions
An atlas can help researchers choose where to look and what to measure. Our first question for follow-up work would be whether a selected pattern recurs in independently collected material. The next would be whether it tracks a meaningful functional difference. Only then does changing the implicated process become a well-defined experimental question.
Even a reproducible difference can be protective, harmful or a response to something else. Reducing a molecular signal simply because it rises with age could miss that distinction. The long-term hope is more precise biological experiments. A claim that an intervention improves people’s lives would require a separate chain of evidence.
The denominator changes the meaning of a million measurements
Sample counts, the age-bin definition and replication exclusions were checked in the primary text and Figure 1 caption. The export contains summary counts; controlled-use human datasets and expression models were not reanalysed.
01Is this a study of more than a million people?
- What was observed
- The discovery atlas contains 1,307,674 nuclei from 284 post-mortem donors in one prefrontal region.
- Where the conclusion stops
- Cells add molecular resolution within people. They do not create a million independent human participants.
Source 1 · Main → An atlas of the DLPFC across the human lifespan
02Were the age groups equally represented?
- What was observed
- The four downstream groups contain 53, 54, 95 and 82 donors. Early-life categories were consolidated as development.
- Where the conclusion stops
- The bars show sampling, not the strength of an ageing effect. Group counts alone do not establish precision or representativeness.
Source 1 · Figure 1e caption; age-group consolidation in Main
03Does 306 mean everyone entered the same validation?
- What was observed
- The integrated replication cohort assembled 306 donors; methods exclude three fetal donors for age-matched validation.
- Where the conclusion stops
- Our subtraction gives 303 for that stated exclusion. This is not a claim about every replication analysis or every usable nucleus.
Source 1 · Methods → Integrated analysis of lifespan replication dataset; Replication of aDEGs
Numbers you can inspect
| Measure | Value & unit | Origin & method |
|---|---|---|
| Discovery donors | 284 donors | Reported People supplying discovery tissue. Source 1 · Main → An atlas of the DLPFC |
| Discovery nuclei after quality filtering | 1307674 nuclei | Reported Molecular measurements nested within donors. Source 1 · Main → An atlas of the DLPFC |
| Development: 0–19 years | 53 donors | Reported Downstream analysis group; counts sum to the 284 discovery donors. Source 1 · Figure 1e caption |
| Young adulthood: 20–39 | 54 donors | Reported Downstream analysis group; counts sum to the 284 discovery donors. Source 1 · Figure 1e caption |
| Middle adulthood: 40–59 | 95 donors | Reported Downstream analysis group; counts sum to the 284 discovery donors. Source 1 · Figure 1e caption |
| Late adulthood: 60+ | 82 donors | Reported Downstream analysis group; counts sum to the 284 discovery donors. Source 1 · Figure 1e caption |
| Assembled replication cohort | 306 donors | Reported Integrated cohort assembled from published sources. Source 1 · Methods → Integrated analysis of lifespan replication dataset |
| Fetal donors excluded for matched-age validation | 3 donors | Reported Exclusion is described specifically for the validation analysis. Source 1 · Methods → Replication of aDEGs, final paragraph |
| Count after that stated validation exclusion | 303 donors | Calculated 306 assembled donors − 3 fetal donors = 303; no other exclusion or dataset-level count is inferred. Source 1 · Methods → Replication of aDEGs, final paragraph |
The export includes claims, available numbers, methods and source locations. It contains our reading notes and published summaries; it is not raw participant data or an independent reanalysis.
Evidence update · 2 Oct 2026
Added discovery age-group counts and a distinction between the assembled replication cohort and the matched-age validation. The derived count is an arithmetic note, not a new statistical analysis. AI source check; no human editorial or clinical review.
Three claims that need different evidence
| Claim | Evidence to look for | Question to keep open |
|---|---|---|
| A pattern differs with age | Measurements with donor-aware analysis | Could other differences explain it? |
| The pattern changes function | Targeted perturbation and functional readout | Was the relevant process actually altered? |
| Changing it helps people | Appropriate human evaluation | Do benefits outweigh harms? |
Our interpretation framework, not a list of experiments completed in this paper.
Your questions, answered
Is this a biological-age test I can take?
No personal testing service is evaluated here. A research reference and a validated individual prediction tool answer different questions. A prediction tool would also need evidence that its output is accurate and useful in the intended population.
Does a change in RNA mean the cell works differently?
It can motivate that hypothesis. Establishing function requires a suitable functional measurement; a molecular association alone does not describe every step between gene activity and an observable outcome.
Why should I care about the source of the tissue?
Collection and inclusion choices affect which people and conditions a study represents. They also help you decide whether a later study is an independent replication or another analysis of overlapping material.
What would make a follow-up especially persuasive?
Independent samples, a clearly specified hypothesis, consistent measurement and a relevant functional experiment. For a proposed health application, add a separate evaluation in the people who would use it.
Limits of this interpretation
- A cross-sectional map cannot establish an individual’s trajectory or the cause of an age association.
- A molecular measurement should not be substituted for cognitive performance or patient benefit.
- We checked selected published material, not the underlying data or analysis pipeline.
Sources & transparency
- Yang, Clarence, Scott et al. (2026): Lifespan single-cell transcriptomic atlas of the human prefrontal cortex
Publisher abstract, discovery sample counts, Figure 1 caption, age-group consolidation, replication results, integrated replication methods and data availability checked. Three fetal donors were excluded from age-matched validation. Raw nuclei, supplementary workbooks, participant metadata and code were not reanalysed. Short factual notes and original interpretation; no publisher figures reproduced. · Accessed 2 Oct 2026
DOI: 10.1038/s41586-026-10271-7
Prepared and source-checked with AI on 30 September 2026. Press-news Team is our collective publication byline, not a claim of medical credentials or human review. No human editorial or clinical review has taken place. We did not conduct these experiments or reanalyse their raw data. The short research reports are followed by our own explanations, comparisons and proposed next questions. Source-access limits are stated below. This is educational reporting on basic research, not a treatment recommendation. The photograph is illustrative. Evidence notes added by AI from the access scope stated below. Calculated values use the printed arithmetic; published point estimates are not an independent reanalysis. No human editorial or clinical review.
Source check: AI source check — linked primary passages, denominator notes and deterministic arithmetic
Clinical review: Not applicable to this educational guide
Suggest a correction