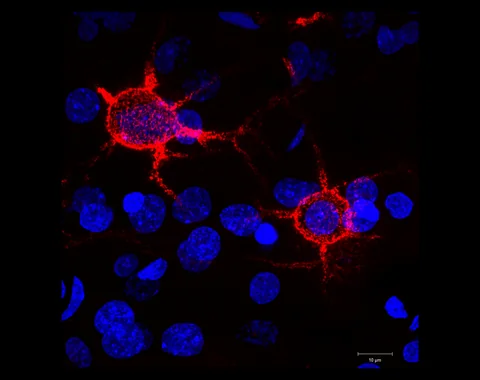
A road map, an elevation map and a map of rainfall can describe the same landscape while revealing different boundaries. Brain maps pose a similar challenge. The question is not simply which picture has the most detail, but what its colours actually represent and what that view helps us test.
- Research published
- Nature · 23 September 2026
- Method
- Mass spectrometry imaging
- Setting
- Basic research in mouse tissue
Original publication: 23 Sep 2026 · The date above refers to this brief.
One map, several levels of grouping
Groups at each hierarchy level
What the researchers mapped
Fusar Bassini and colleagues mapped 172 lipids across 109 sections from 11 mice. They grouped the spatial chemical patterns into 539 regions called lipizones. These often related to anatomy, cell composition and connectivity, but did not simply reproduce traditional anatomical divisions. The work offers a biochemical reference rather than a diagnostic test.
Source 1 ↗Why the border on a map changes the question
Consider a hypothetical tissue sample containing two neighbouring zones. If one zone has much more of a molecule than the other, combining them gives an average that describes neither very well. A difference between two samples could then reflect which zones were collected, rather than a change within the same biological compartment.
That thought experiment explains why sampling boundaries deserve attention. Before interpreting a colour or a bar, ask whether the comparison concerns the same location and tissue mixture. A more detailed map can help define a comparison; it cannot rescue a comparison whose specimens were selected inconsistently.
How this extends an older line of research
In 2021, Ding and colleagues reported an atlas of 1,547 metabolites across ten mouse brain regions and several ages. They found strong differences across regions and age groups. That earlier study is useful context for why both location and life stage matter in brain chemistry.
Source 2 ↗More molecules and finer locations are different kinds of detail
It would be misleading to rank the two atlases by their headline molecule counts alone. Our comparison separates chemical coverage from spatial resolution. One question asks how many kinds of molecule were assessed. Another asks how precisely a measurement can be placed in tissue. A third asks how many independent animals and conditions were examined.
Different techniques can make different compromises across these dimensions. There is no single score that captures all of them. Read the table as a worksheet for comparing designs, not a declaration that one atlas has replaced another. Our companion human-cell atlas article adds another distinction: measuring RNA is not the same task as measuring the molecules found in a tissue sample.
What the next useful experiment could look like
Here is a follow-up we would like to see: choose a small number of mapped compartments, define a specific biological hypothesis, and test it in independently collected tissue using an additional measurement method. Matching tissue boundaries and recording uncertainty would make the comparison easier to interpret.
If the intended question concerns a disease, the next design must specify the condition, appropriate comparison samples and possible confounders. If it concerns mechanism, a targeted intervention and a functional readout would be needed. These are proposals, not findings of this atlas. The near-term promise is better experimental targeting and more reproducible sampling; a route to diagnosis or treatment would need its own evidence.
What “more detailed” can mean
| Dimension | What to record | What it does not tell you |
|---|---|---|
| Chemical coverage | Which molecules can be detected and identified | How precisely each measurement is located |
| Spatial detail | Sampling footprint and anatomical alignment | How many independent animals were studied |
| Biological coverage | Animals, ages, sexes and conditions | Whether an observed association is causal |
| Functional evidence | A defined intervention and readout | Whether a finding transfers to people |
Our comparison worksheet; it does not rank the two studies or equate their assays.
Your questions, answered
Are these colours a photograph of fat?
A scientific colour map encodes measured or computed values. Check the legend and processing steps: a colour may represent a molecule, a relative abundance or membership of a statistical group. It is not necessarily the tissue’s visible colour.
Does a new cluster count mean new brain organs were discovered?
A clustering procedure groups similar measurements at a chosen resolution. Biological interpretation needs more than the number of groups. Ask whether the grouping is stable, reproducible and useful for a particular question.
Could eating a certain fat reproduce a pattern on this map?
A map alone cannot answer an intervention question. Diet, transport, metabolism and tissue function would all need appropriate experiments. No dietary recommendation follows from the colour or name of a mapped molecule.
How does this connect to our human brain atlas story?
Compare the unit and purpose of each measurement before comparing conclusions. The useful connection is complementary questions about biology, not a claim that a mouse tissue map predicts an individual person’s health.
Limits of this interpretation
- Atlas resolution and clustering choices influence the boundaries readers see.
- Animal tissue mapping alone does not establish a human diagnostic or nutritional application.
- Source checking covered indexed results and captions, not complete methods, supplements or raw spectra.
Sources & transparency
- Fusar Bassini, Schede, Capolupo et al. (2026): The lipidomic architecture of the mouse brain
Publisher-indexed main text and figure captions checked, including the atlas sample and clustering hierarchy. Direct HTML retrieval failed. Complete methods, supplements and raw spectra were not independently assessed. Short factual account; no publisher figures reproduced. · Accessed 30 Sep 2026
DOI: 10.1038/s41586-026-11050-0 - Ding, Ji, Rabow et al. (2021): A metabolome atlas of the aging mouse brain
Publisher abstract and selected atlas-design results checked for historical context. This is a separate 2021 study, not additional data from the new atlas. No raw-data reanalysis. · Accessed 30 Sep 2026
DOI: 10.1038/s41467-021-26310-y
Prepared and source-checked with AI on 30 September 2026. Press-news Team is our collective publication byline, not a claim of medical credentials or human review. No human editorial or clinical review has taken place. We did not conduct these experiments or reanalyse their raw data. The short research reports are followed by our own explanations, comparisons and proposed next questions. Source-access limits are stated below. This is educational reporting on basic research, not a treatment recommendation. The photograph is illustrative.
Source check: AI source check — primary publications, dates and selected reported findings
Clinical review: Not applicable to this educational guide
Suggest a correction