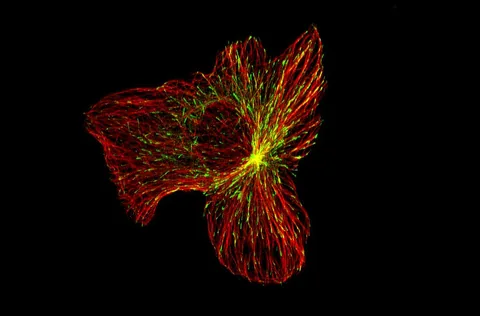
A cell atlas can suggest which cells deserve a closer look. It cannot, on its own, show that a particular treatment will heal a human fracture.
- The mouse atlas contains 89,047 cells; the separate human atlas contains 60,746 cells.
- The researchers combined existing and newly generated datasets. Their mouse fracture experiments are distinct from the human atlas.
- A particular 28-day mouse imaging comparison included four animals per group; it is not a trial in people.
- Paper date
- 15 November 2026
- Mouse atlas
- 89,047 cells
- Human atlas
- 60,746 cells
Original publication: 15 Nov 2026 · The date above refers to this brief.
Two separate cell atlases
cells
From cell map to mechanism
Map
Compare mouse and human stromal cell atlases.
Resolve
Examine RNA and accessible chromatin in selected mouse cells.
Test
Use a mouse injury model to investigate a proposed role for Sox9.
The question behind the map
After a bone injury, cells from different tissues can contribute to repair in different ways. The study asks whether their gene activity and accessible regions of DNA, called chromatin, help explain those different trajectories. It brings together two kinds of evidence: cell atlases and experiments in mice.
Source 1 ↗Two atlases, not two patient groups
The mouse atlas contains 89,047 cells; the human atlas contains 60,746. These are cell counts after filtering and integration, not numbers of people or mice. The authors combined datasets generated in their laboratory with public datasets. Differences in source, tissue and sample processing matter when comparing maps.
Source 1 ↗Why look beyond gene activity?
Some cells from the periosteum, a tissue surrounding bone, and skeletal muscle had similar RNA profiles but distinct patterns of chromatin accessibility. Accessibility describes regions that experimental assays find more exposed; it is not a direct film of a cell choosing its future. The finding suggests that a snapshot of RNA alone can miss regulatory differences.
Source 1 ↗What the mouse experiment adds
The authors tested the role of Sox9 in selected cell populations in a mouse fracture model. In one imaging comparison, they assessed bone union at day 28 with four mice per group. That intervention provides evidence about the tested mouse model; the human atlas does not show that the same manipulation improves fracture healing in people.
Source 1 ↗A useful next question
A stronger bridge to human repair would require carefully characterized human samples across healing stages and independent tests of proposed cell programs. The separate colon-repair explainer shows a similar distinction: a map and a mechanism experiment can complement each other while still leaving the clinical question open.
A cell count is not a patient count
Accepted primary manuscript PDF accessed through a research search interface: abstract, Figure 1 caption, Figure 4 and Figure 6 captions, and atlas methods. The accepted manuscript may be edited. Publisher metadata and abstract also checked. Supplements, source-data files, code and clinical records were not independently audited. No publisher figure reproduced.
01Were the human results a fracture-treatment trial?
- What was observed
- The authors constructed a human cell atlas and separately carried out fracture experiments in mice.
- Where the conclusion stops
- A human atlas is not a human intervention study.
Source 1 · Accepted manuscript abstract, Figure 1 and Figure 6 captions
02Do more than 100,000 atlas cells mean more than 100,000 participants?
- What was observed
- The two atlases contain 89,047 mouse cells and 60,746 human cells.
- Where the conclusion stops
- Cells are observations within datasets, not independent patients.
Source 1 · Accepted manuscript Figure 1 caption
Numbers you can inspect
| Measure | Value & unit | Origin & method |
|---|---|---|
| Mouse atlas | 89047 cells | Reported Integrated mouse stromal atlas after filtering. Source 1 · Accepted manuscript Figure 1 caption |
| Human atlas | 60746 cells | Reported Integrated human stromal atlas after filtering. Source 1 · Accepted manuscript Figure 1 caption |
| Imaging comparison per group | 4 mice | Reported Number per group in the day-28 bone-union imaging comparison. Source 1 · Accepted manuscript Figure 6g caption |
| Imaging follow-up | 28 days | Reported Time after fracture for the specified imaging comparison. Source 1 · Accepted manuscript Figure 6f–g caption |
Compare the actual experiments
These studies answer different questions. Read the unit and endpoint before comparing results.
| Study | Unit & setting | Readout | Interpretation boundary |
|---|---|---|---|
| Human and mouse atlas Source 1 · Accepted manuscript Figure 1 caption | Filtered cells from multiple datasets | RNA-based cell populations | Cell counts are not the numbers of participants. |
| Mouse fracture mechanism Source 1 · Accepted manuscript Figure 6f–g caption | Four mice per group in the specified imaging comparison | Bone union at day 28 | The tested intervention is not a human therapy. |
The export includes claims, available numbers, methods and source locations. It contains our reading notes and published summaries; it is not raw participant data or an independent reanalysis.
Evidence update · 17 Nov 2026
First publication. Reported observations, arithmetic and proposed follow-up questions are separated. No raw-data reanalysis. AI source check; no human editorial or clinical review.
What each part of the study can answer
| Reading question | What the paper reports | What remains open |
|---|---|---|
| Mouse atlas | 89,047 integrated cells | Cell count, not number of mice |
| Human atlas | 60,746 integrated cells | An atlas, not a human treatment trial |
| RNA plus chromatin | Molecular profiles in uninjured mouse cells | Profiles suggest regulatory potential, not certain fate |
| Fracture experiment | Day-28 imaging; four mice per group in the specified comparison | A mouse result with a small group size |
Original Press-News reading framework. Follow-up questions are our interpretation, not experiments performed by the authors.
Your questions, answered
Are there 60,746 human participants?
No. That is the number of cells in the human atlas.
Did the researchers test fracture treatment in patients?
No. The injury and gene-manipulation experiments discussed here were in mice.
Does accessible chromatin guarantee a cell will become bone?
No. It is evidence of regulatory state, not a guaranteed future outcome.
Can this be compared with intestinal repair research?
Both combine cell-state measurements with model experiments, but they involve different tissues and injury models.
Limits of this interpretation
- The atlas cell counts are not participant counts; the included datasets have different sources and processing histories.
- Chromatin accessibility and RNA profiles are measurements of cell state, not direct proof of an individual cell’s future.
- The fracture intervention and the four-per-group imaging comparison were performed in mice.
- No human fracture treatment or clinical benefit was tested in this report.
Sources & transparency
- Ethel, Goachet, Perrin et al. (2026): Chromatin priming of skeletal stem and progenitor cells governs cell fate during bone repair
Accepted primary manuscript PDF accessed through a research search interface: abstract, Figure 1 caption, Figure 4 and Figure 6 captions, and atlas methods. The accepted manuscript may be edited. Publisher metadata and abstract also checked. Supplements, source-data files, code and clinical records were not independently audited. No publisher figure reproduced. · Accessed 17 Nov 2026
DOI: 10.1038/s41467-026-79160-x
Prepared and source-checked with AI. Press-news Team is the collective publication byline, not a medical reviewer. No human editorial or clinical review has taken place. This educational article examines research methods and laboratory or observational findings, not individual diagnosis or treatment. We did not conduct these experiments or reanalyse raw data. Reported results, our interpretation and proposed future tests are separated. Source-access limits are recorded below. Photographs are illustrative.
Source check: AI source check — selected primary results, captions and study boundaries
Clinical review: Not applicable to this educational guide
Suggest a correction