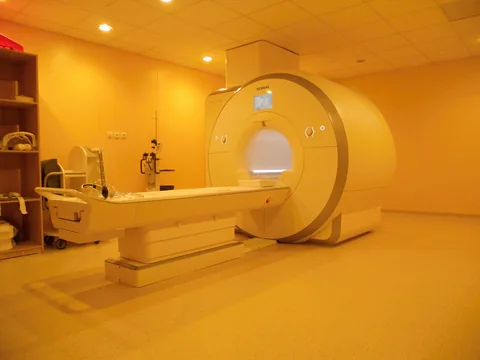
Two children can have similar brain volumes at age seven after starting at different points as newborns. Bonthrone and colleagues linked MRI scans at those two ages to ask about growth. They also asked how the association between growth and a childhood cognitive score changed when the model included family circumstances.
- The cohort included 137 children. A total of 117 had complete data on the four social and environmental measures.
- The lowest income category was associated with lower cortical gray matter growth scores and less expansion of cerebrospinal fluid around the brain in the model.
- The brainstem association with cognitive scores persisted after adjustment for social and environmental factors. The cortical gray matter association became uncertain.
- Paper date
- 21 November 2026
- Participants
- 137 children, 25 with congenital heart disease
- MRI visits
- Neonatal period and ages 6 to 8
- Complete social and environmental data
- 117 children
Original publication: 21 Nov 2026 · The date above refers to this brief.
Children contributing to the two sample counts
children
From two scans to a comparison of growth
Measure early brain volume
The neonatal scan provides the starting measurement.
Measure again in middle childhood
The scan at ages six to eight provides the later measurement.
Compare estimated growth
Relate standardized growth scores to the measured family factors and cognitive scores.
A growth score compares a child’s two measurements
The authors modeled expected growth using repeated scans from their reference group. They accounted for starting brain volume, age at each scan and sex. A growth Z-score then describes how a child’s measured change compares with the change expected under that model. The estimates in the income comparison use this standardized scale.
Source 1 ↗The income comparison used a smaller set of children
Of the 137 children with paired scans, 117 had full data on household income, maternal education, neighborhood deprivation and early home stimulation. That is 85.4% of the sample. Families reported income at the later visit. The study compares groups defined by that reported income, with fewer observations than the headline enrollment number.
Source 1 ↗Read the income estimates with their reference group
The paper compares annual household income below £30,000 with a reference above £149,999. The estimated differences were −1.14 for cortical gray matter growth and −1.55 for expansion of cerebrospinal fluid outside the brain, in standardized growth units. Both intervals remained on the negative side of zero. The income measured at follow-up does not show how each family’s circumstances changed between visits.
Source 1 ↗The adjustment changed the IQ comparison
The initial model linked a one-standard-deviation larger cortical gray matter growth score to about 3.89 higher IQ points. After including the social and environmental measures, the cortical estimate had a p-value of 0.177. The brainstem association persisted, at about 3 IQ points per standard deviation in the adjusted model. These are group-level statistical associations at ages six to eight.
Source 1 ↗What measurements would help explain the pattern?
Tracking household circumstances at several points and adding more scans could show whether changes in circumstances precede changes in growth. Testing the same analysis in a new group could show how much the results depend on recruitment and on the reference model used for brain growth.
Source 1 ↗Separate the growth comparison from the cognitive score
Primary journal article. Checked participant selection, completeness of family data, the growth model, reported income and IQ results, and the timing of measurements.
01What do the income coefficients measure?
- What was observed
- The reported differences use standardized growth scores for two separate MRI measures.
- Where the conclusion stops
- They compare the lowest income category against the highest and depend on the reference model.
Source 1 · Results and Table 2
02Did the same IQ association persist under all adjustments?
- What was observed
- The brainstem association persisted after adding social and environmental measures, while the cortical association had p=0.177.
- Where the conclusion stops
- Adjustment describes the data under the authors’ model. The direction of any causal pathway needs other evidence.
Source 1 · Results and Table 3
Numbers you can inspect
| Measure | Value & unit | Origin & method |
|---|---|---|
| Paired-scan cohort | 137 children | Reported Total sample with neonatal and later MRI. Source 1 · Results, Participant demographics |
| Participants with congenital heart disease | 25 children | Reported Subgroup within the paired-scan cohort. Source 1 · Results and Table 1 |
| Complete family and area measures | 117 children | Reported Complete observations for all four measures. Source 1 · Results, Participant demographics |
| Complete-data share | 85.4 percent | Calculated Divide 117 by 137 and multiply by 100, rounded to one decimal. Source 1 · Results, Participant demographics |
| Cortical growth, lowest versus highest income | -1.14 growth Z-score units | Reported Adjusted difference, 95% CI −1.88 to −0.396. Source 1 · Abstract and Table 2 |
| Extracerebral fluid expansion, income comparison | -1.55 growth Z-score units | Reported Adjusted difference, 95% CI −2.51 to −0.585. Source 1 · Abstract and Table 2 |
| Earlier cortical growth association with IQ | 3.89 IQ points per growth SD | Reported Before adding socio-environmental variables. 95% CI 1.12 to 6.65. Source 1 · Abstract and Results, Table 3 |
| Cortical growth and IQ after additional adjustment | 0.177 p-value | Reported Reported model including socio-environmental variables. Source 1 · Results, Table 3 |
| Brainstem growth and IQ after additional adjustment | 3 IQ points per growth SD | Reported Approximation reported in the journal Results. Source 1 · Results, predictors of full-scale IQ |
Compare the actual experiments
These studies answer different questions. Read the unit and endpoint before comparing results.
| Study | Unit & setting | Readout | Interpretation boundary |
|---|---|---|---|
| Age from images and growth from repeated images Source 1 · Methods, image analysis | Adult cohorts and paired childhood scans | Image-predicted age and a standardized growth score | Read each image-derived estimate alongside the reference data and the outcome it represents. |
| Time of a measurement and time of change Source 1 · Methods, socio-environmental data | Children with measured household circumstances | Follow-up income and MRI growth between visits | To assess whether a change in circumstances came first would require observations before the later visit. |
The export includes claims, available numbers, methods and source locations. It contains our reading notes and published summaries; it is not raw participant data or an independent reanalysis.
Evidence update · 21 Nov 2026
First publication. Any calculations in this brief use reported figures. The reading notes identify possible follow-up questions. AI source check; no human editorial or clinical review.
Which model produced each estimate?
| Comparison | Estimate | Model and scale |
|---|---|---|
| Cortical gray matter and household income | −1.14 (95% CI −1.88 to −0.396) | Lowest versus highest income category, in growth Z-score units. |
| Fluid outside the brain and household income | −1.55 (95% CI −2.51 to −0.585) | Same income comparison, for a separate MRI measurement. |
| Cortical growth and full-scale IQ | +3.89 points (95% CI 1.12 to 6.65) | Model before adding household and neighborhood factors. |
| Brainstem growth and full-scale IQ | About +3 IQ points per standard deviation | Model including measured social and environmental factors. |
Reported values from the Abstract and Results. MRI growth units and IQ points describe separate outcomes.
Your questions, answered
Did all 137 children contribute full family data?
The paired-scan cohort had 137 children. Complete data on all four measured social and environmental factors were available for 117.
Does −1.14 mean the brain was 1.14% smaller?
The number is a difference in standardized growth scores. It compares the model’s estimates for two income groups.
When did the researchers record household income?
Parents reported household income at the visit in middle childhood. Earlier conditions would need separate measurements.
Does adding more variables prove what causes the change?
Adjustment estimates how the relationship looks when measured factors are held constant in a model. A causal explanation requires a design that can address other influences and their timing.
Limits of this interpretation
- Household income and neighborhood measures represent circumstances reported or recorded at follow-up.
- The observational design leaves room for other influences on brain growth and cognitive scores.
- Participants came from selected cohorts and 20 lacked complete social and environmental data.
Sources & transparency
- Bonthrone, Gal-Er, MacLeod et al. (2026) — The relationship between socio-environmental factors, brain growth and cognition in middle childhood
Primary journal article. Checked participant selection, completeness of family data, the growth model, reported income and IQ results, and the timing of measurements. · Accessed 21 Nov 2026
DOI: 10.1038/s41390-026-05677-y
Prepared and source-checked with AI for Press-news Team. The source notes identify the material available during preparation. The article received no human editorial or clinical review. The source list supports the reported results and the calculations shown.
Source check: AI source check — primary research and stated source limits
Clinical review: Not applicable to this educational guide
Suggest a correction