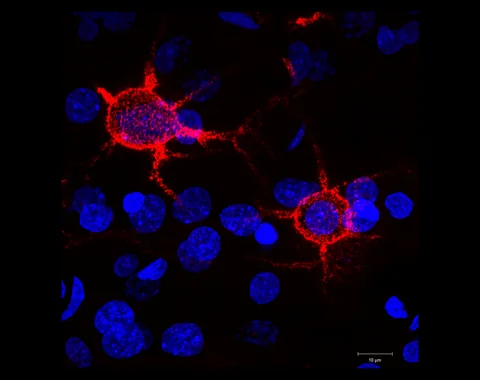
A new imaging and computational method turns time-lapse pictures of tumour cells into movement paths. Its most useful lesson may be how many different kinds of sample sit behind one headline number.
- The researchers used six patient-derived tumour models grown in mice and then observed brain slices outside the animals.
- One figure describes 123 slices from 56 mice; another analysis counts 18,716 cells within one model.
- The framework is a research tool, not a demonstrated way to choose treatment or predict an individual patient’s outcome.
- Paper date
- 2 November 2026
- Study model
- Patient-derived cells in mouse brain slices
- Focus
- Cell movement over time
Original publication: 2 Nov 2026 · The date above refers to this brief.
From a tumour model to a movement estimate
Model
Patient-derived tumour models are established in mice.
Image
Brain slices are observed over time outside the animal.
Infer
Computational labels and trajectories summarise cell movement within the model.
What was actually observed?
The researchers used patient-derived glioblastoma cell models established in mice. They made brain slices from those models and recorded time-lapse images outside the animals. The result is an ex vivo model: human-derived tumour cells appear in mouse tissue under laboratory conditions.
Source 1 ↗Four nested levels of counting
The paper describes six patient-derived models. Figure 4B pools 123 slices from 56 mice across the models. Figure 4C describes a separate analysis of 18,716 cells from 21 slices and 15 mice in one model. Cells within a slice, slices from a mouse and mice carrying the same model are related observations; they are not 18,716 independent patients.
Source 1 ↗From pictures to paths
GlioTrace uses imaging, a classifier of cell shape and a statistical model to infer changes between movement-related states. The inferred categories help summarise patterns in the images. They remain dependent on the image quality, chosen labels and assumptions of the model; a predicted state is not a direct measurement of every biological mechanism.
Source 1 ↗What the research can and cannot show
The authors describe differences in movement patterns across the six selected models. They also examined experimental perturbations. Those observations can help researchers formulate questions about tumour-cell behaviour; they do not establish which treatment will work for a patient or predict survival or recurrence.
Source 1 ↗Why the model has limits
The mice used for the patient-derived models lack functional T and B lymphocytes, and the slice preparation does not reproduce every feature of an intact brain. The authors also describe two-channel imaging and two-dimensional projections rather than complete three-dimensional tracking. Six selected models are too few for robust conclusions about all tumour subtypes.
Source 1 ↗A related way to read the evidence
Our article on moving cells and vesicles also looks at a laboratory observation without turning it into a clinical result. In both cases, the model can reveal a phenomenon worth investigating while leaving open how often it occurs in people and what it means for care.
People, mice, slices and cells are different units
Primary PDF: study design and model description, Fig. 4 and caption p. 7, and Discussion limitations. Fig. 4 was visually inspected. Publisher metadata and abstract also checked. Supplements, source-data files, code and clinical records were not independently audited. No publisher figure reproduced.
01What does 123 describe?
- What was observed
- Figure 4B describes 123 brain slices from 56 mice across the models.
- Where the conclusion stops
- The slices are not 123 patients and may be clustered within mice.
Source 1 · Primary PDF Fig. 4B caption p. 7
02What does 18,716 describe?
- What was observed
- Figure 4C reports 18,716 cells in 21 slices from 15 mice in one model.
- Where the conclusion stops
- Those cells are nested laboratory observations, not independent patient outcomes.
Source 1 · Primary PDF Fig. 4C caption p. 7
Numbers you can inspect
| Measure | Value & unit | Origin & method |
|---|---|---|
| Patient-derived models | 6 models | Reported Selected tumour models used in the study. Source 1 · Primary PDF abstract and Results |
| Mice in Figure 4B | 56 mice | Reported Mouse hosts represented in the pooled slice analysis. Source 1 · Primary PDF Fig. 4B caption p. 7 |
| Slices in Figure 4B | 123 slices | Reported Slices across models; not people. Source 1 · Primary PDF Fig. 4B caption p. 7 |
| Cells in Figure 4C | 18716 cells | Reported Cell count in one model, from 21 slices and 15 mice. Source 1 · Primary PDF Fig. 4C caption p. 7 |
Compare the actual experiments
These studies answer different questions. Read the unit and endpoint before comparing results.
| Study | Unit & setting | Readout | Interpretation boundary |
|---|---|---|---|
| Across-model sample Source 1 · Primary PDF Fig. 4B p. 7 | 123 slices from 56 mice | Distribution of image-derived morphology states | Several slices can belong to the same mouse. |
| One-model speed analysis Source 1 · Primary PDF Fig. 4C p. 7 | 18,716 cells from 21 slices and 15 mice | Cell speed distributions | A cell is not a patient or an independent clinical outcome. |
The export includes claims, available numbers, methods and source locations. It contains our reading notes and published summaries; it is not raw participant data or an independent reanalysis.
Evidence update · 8 Nov 2026
First publication. Reported observations, arithmetic and proposed follow-up questions are separated. No raw-data reanalysis. AI source check; no human editorial or clinical review.
Which sample is being counted?
| Reading question | What the paper reports | What remains open |
|---|---|---|
| Patient-derived models | Six models selected for the study | Six models do not represent every glioblastoma |
| Mice and slices | Figure 4B: 123 slices from 56 mice | Several slices can come from one mouse |
| Cells in one analysis | Figure 4C: 18,716 cells in 21 slices from 15 mice, one model | Cells are not independent patients |
| Clinical outcome | The method maps observed cell movement | Survival and treatment response in people were not established |
Original Press-News reading framework. Follow-up questions are our interpretation, not experiments performed by the authors.
Your questions, answered
Were 18,716 patients studied?
No. That is a cell count in one analysis of one model, from 21 slices and 15 mice.
Were the slices taken directly from patients?
The described experiment used mouse brain slices containing patient-derived tumour models.
Can the method select an individual treatment today?
The paper presents a research framework; it does not validate clinical treatment selection.
Why do immune cells matter?
The models lack functional T and B lymphocytes, so they do not reproduce the full adaptive immune environment of a human tumour.
Limits of this interpretation
- The observations come from mouse brain slices containing patient-derived tumour models, not live imaging of patients.
- Cells, slices, mice and patient-derived models are nested units rather than interchangeable sample sizes.
- The selected models lack adaptive immune components present in people, and imaging uses projections rather than full 3D tracking.
- Clinical outcomes and treatment selection were not validated; code and raw images were not independently audited.
Sources & transparency
- Reconstructing the single-cell spatiotemporal dynamics of glioblastoma invasion
Primary PDF: study design and model description, Fig. 4 and caption p. 7, and Discussion limitations. Fig. 4 was visually inspected. Publisher metadata and abstract also checked. Supplements, source-data files, code and clinical records were not independently audited. No publisher figure reproduced. · Accessed 8 Nov 2026
DOI: 10.1038/s41467-026-78908-9
Prepared and source-checked with AI. Press-news Team is the collective publication byline, not a medical reviewer. No human editorial or clinical review has taken place. This educational article examines research methods and laboratory or observational findings, not individual diagnosis or treatment. We did not conduct these experiments or reanalyse raw data. Reported results, our interpretation and proposed future tests are separated. Source-access limits are recorded below. Photographs are illustrative.
Source check: AI source check — selected primary PDF results, captions and study boundaries
Clinical review: Not applicable to this educational guide
Suggest a correction