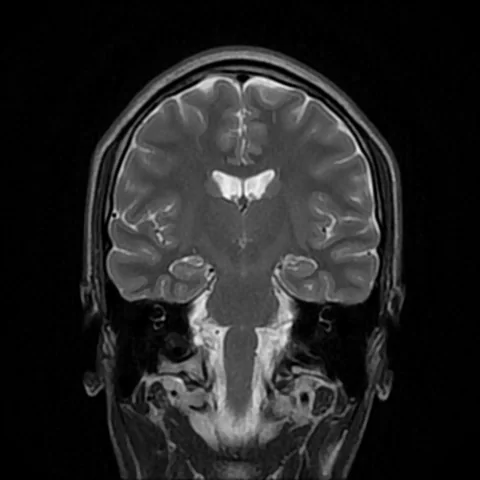
A gene can be associated with disease without revealing how it acts. This study builds a bridge from genetic signals to cellular experiments — while showing why cell identity matters.
- The team used 261 stem-cell lines from 254 European donors to make microglia-like cells.
- A separate cellular-phenotype analysis included 243 donors; the roughly two million retained cells are not two million donors.
- A TREM2 perturbation had different effects in two laboratory cell types. This is not evidence for an individual diagnosis or treatment.
- Paper date
- 17 November 2026
- Starting resource
- 261 lines from 254 donors
- Laboratory model
- Microglia-like cells
Original publication: 17 Nov 2026 · The date above refers to this brief.
A count within a count
genes
Three steps from genetics to a test
Profile
Measure gene activity and cell behavior in stem-cell-derived models.
Compare
Test genetic signals for overlap with disease-association datasets.
Perturb
Investigate selected genes in cell models and compare contexts.
Why use cells made in a dish?
Microglia are immune cells of the central nervous system, but obtaining living human brain microglia for large experiments is difficult. The researchers turned induced pluripotent stem cells into microglia-like cells and studied them in groups, or pools. These cells model aspects of microglia; they are not a complete human brain.
Source 1 ↗Lines, donors and cells are different counts
The paper describes 261 stem-cell lines from 254 donors of European ancestry. Some donors contributed more than one line. After quality control the pooled experiment retained approximately two million cells. An analysis of migration and particle uptake used 243 donors; these numbers answer different questions and should not be added.
Source 1 ↗From an association to a more specific question
The authors compared genetic variation with gene activity, then examined overlap with previously published disease-association studies. They reported 79 unique genes for which signals colocalized. Colocalization is a statistical argument about shared signals, not proof that changing a particular gene will prevent disease. The paper notes that the samples have limited ancestry diversity.
Source 1 ↗One surprising laboratory comparison
The team also perturbed TREM2 in cell models and measured a signal related to engulfment. In one matched-line comparison, the signal rose in microglia-like cells and fell in macrophage-like cells. The assay measures several linked processes, including uptake and degradation; an opposite direction in a dish does not establish what will happen in a person’s brain.
Source 1 ↗What would strengthen the bridge?
Independent work in larger, more diverse donor collections, different cellular states and other models could test which relationships persist. An author reports founding and consulting for a biotechnology company, while two were company employees when the manuscript was submitted. The earlier Press-News genetic-atlas story explains why shared genetic signals still require careful interpretation.
Source 1 ↗A cell, a line and a donor are not the same unit
Publisher HTML: abstract, selected Results, Methods, Figure 3 and 5 captions, and competing interests, accessed through a research-search interface. Publisher metadata and abstract also checked. Supplements, source-data files, code and clinical records were not independently audited. No publisher figure reproduced.
01Did the study use 261 different people?
- What was observed
- The Methods describe 261 iPSC lines from 254 European donors.
- Where the conclusion stops
- Some donors contributed more than one line.
Source 1 · Publisher Methods, human iPSC maintenance
02Does TREM2 perturbation always move the assay in the same direction?
- What was observed
- A matched-line comparison reported increased signal in microglia-like cells and reduced signal in macrophage-like cells.
- Where the conclusion stops
- The direction is specific to the tested assay and cell context.
Source 1 · Publisher Results, divergent phagocytic activity and Figure 5k
Numbers you can inspect
| Measure | Value & unit | Origin & method |
|---|---|---|
| Stem-cell lines | 261 lines | Reported Human iPSC lines in the starting resource. Source 1 · Publisher Methods, human iPSC maintenance |
| Donors in the starting resource | 254 donors | Reported European donors contributing the 261 lines. Source 1 · Publisher Methods, human iPSC maintenance |
| Donors in phenotype analysis | 243 donors | Reported Donors in the uptake and migration analysis. Source 1 · Publisher Figure 3a caption |
| Unique colocalizing genes | 79 genes | Reported Unique genes whose gene-activity associations colocalized with disease GWAS signals. Source 1 · Publisher Results, genetic overlap |
| Genes with low prioritization score | 37 genes | Reported Subset of the 79 with reported locus-to-gene score below 0.2. Source 1 · Publisher Results, genetic overlap |
| Low-score proportion | 46.8 percent | Calculated 37 divided by 79 times 100, rounded to one decimal place. Source 1 · Publisher Results, genetic overlap |
Compare the actual experiments
These studies answer different questions. Read the unit and endpoint before comparing results.
| Study | Unit & setting | Readout | Interpretation boundary |
|---|---|---|---|
| Genetic colocalization Source 1 · Publisher Results, genetic overlap | Genes and genetic loci | Overlap between molecular and disease-association signals | A statistical shared-signal hypothesis, not a proven therapy. |
| TREM2 cell comparison Source 1 · Publisher Results and Figure 5k | Microglia-like and macrophage-like cells | Uptake-associated readout after perturbation | The assay and model differ from a human clinical outcome. |
The export includes claims, available numbers, methods and source locations. It contains our reading notes and published summaries; it is not raw participant data or an independent reanalysis.
Evidence update · 17 Nov 2026
First publication. Reported observations, arithmetic and proposed follow-up questions are separated. No raw-data reanalysis. AI source check; no human editorial or clinical review.
A map, a genetic overlap and an experiment
| Reading question | What the paper reports | What remains open |
|---|---|---|
| Cell resource | 261 lines from 254 donors; about two million cells after quality control | Lines and cells are not independent patients |
| Phenotype analysis | 243 donors in the uptake and migration analysis | A distinct analysis, not an additional cohort to add |
| Genetic overlap | 79 unique colocalizing genes across four disease studies | A shared signal does not prove treatment benefit |
| TREM2 comparison | Opposite assay directions in two cell types | The model is not an outcome in a patient |
Original Press-News reading framework. Follow-up questions are our interpretation, not experiments performed by the authors.
Your questions, answered
Were two million people studied?
No. Approximately two million cells were retained after quality control. The resource comprised 261 lines from 254 donors.
Does a genetic overlap prove that a gene causes disease?
No. It can support a shared-signal hypothesis, which requires further testing.
Were these cells taken directly from living brains?
The main model used microglia-like cells generated from human induced pluripotent stem cells.
Does the TREM2 result show how to treat dementia?
No. It compares laboratory cell responses and does not establish a treatment effect in people.
Limits of this interpretation
- The donors were of European ancestry, so findings need evaluation in more diverse populations.
- Stem-cell-derived microglia-like cells are a model and do not reproduce the complete human brain.
- Colocalization and cell assays do not establish individual disease risk or treatment effects.
- A reported engulfment readout combines uptake, acidification and degradation; results can depend on cell type and state.
- The paper discloses biotechnology and pharmaceutical affiliations.
Sources & transparency
- Perez-Alcantara, Washer, Chen et al. (2026): Integrated QTL mapping and CRISPR screening in pooled iPSC-derived microglia reveals genetic drivers of neurodegenerative risk
Publisher HTML: abstract, selected Results, Methods, Figure 3 and 5 captions, and competing interests, accessed through a research-search interface. Publisher metadata and abstract also checked. Supplements, source-data files, code and clinical records were not independently audited. No publisher figure reproduced. · Accessed 17 Nov 2026
DOI: 10.1038/s41588-026-02843-0
Prepared and source-checked with AI. Press-news Team is the collective publication byline, not a medical reviewer. No human editorial or clinical review has taken place. This educational article examines research methods and laboratory or observational findings, not individual diagnosis or treatment. We did not conduct these experiments or reanalyse raw data. Reported results, our interpretation and proposed future tests are separated. Source-access limits are recorded below. Photographs are illustrative.
Source check: AI source check — selected primary results, captions and study boundaries
Clinical review: Not applicable to this educational guide
Suggest a correction