A colorful map with arrows can make a proposed path of cell change look more certain than it is. A new method focuses on one source of uncertainty: what can happen when complex measurements are compressed into two dimensions.
- The accepted paper’s abstract describes a statistical test called velotest for the faithfulness of RNA-velocity visualizations.
- The authors report that projection quality varied across methods, datasets and regions of a dataset.
- A faithful projection of a model does not by itself prove that the underlying model captures the actual biological future of a cell.
- Paper date
- 20 November 2026
- Tool
- velotest
- Checked source
- Publisher abstract and disclosures
Original publication: 20 Nov 2026 · The date above refers to this brief.
Read an arrow in three steps
Estimate
Build a high-dimensional model of possible cell-state change.
Project
Display an estimated direction on a two-dimensional map.
Interrogate
Ask whether the projection is faithful and whether the underlying estimate has independent support.
What does an arrow mean?
Single-cell RNA analysis can summarize many measurements per cell. RNA velocity methods use those measurements to estimate a direction of change in a high-dimensional representation; researchers often show the estimated direction as arrows on a two-dimensional map. Such an arrow is a model-based visualization, not a time-lapse video of that individual cell.
Source 1 ↗The compression problem
A two-dimensional picture necessarily compresses a more complex representation. The paper’s abstract explains that an embedding may fail to preserve aspects of the original structure, potentially making a projected transition look misleading. An apparently smooth arrow field is therefore a reason to inspect how the picture was built, not proof that cells followed the path shown.
Source 1 ↗What the new test examines
The authors describe velotest as a cell-level statistical test of how faithfully an embedding represents its high-dimensional velocity counterpart. According to the abstract, the assessed quality differed by embedding method, dataset and region. The check concerns a relationship between a picture and its modeled input; it is not described as a direct test of a patient or a treatment.
Source 1 ↗A second question still remains
Even if a projection represents its high-dimensional input faithfully, the biological interpretation also depends on the assumptions and quality of the underlying RNA-velocity estimate. That is a separate question from projection fidelity. Comparing predictions with independent experiments would be a useful next step; it is not a validation result claimed here.
What we could not check
Only the publisher’s abstract and disclosure statement were accessible for this article. We could not inspect the full methods, figures, dataset sizes, statistical thresholds or independent validations of the accepted manuscript. The publisher identifies it as an accepted version that may still be edited.
Source 1 ↗An accurate picture can still represent an imperfect model
Publisher abstract, publication details and competing-interest statement only. Full accepted-manuscript methods, figures, dataset sizes and test implementation were not accessible for this check. Publisher metadata and abstract also checked. Supplements, source-data files, code and clinical records were not independently audited. No publisher figure reproduced.
01Is a visible arrow a directly observed cell future?
- What was observed
- The abstract describes a visualization of estimated RNA velocities.
- Where the conclusion stops
- A projection is not itself a time-lapse observation of an individual cell.
Source 1 · Publisher abstract
02Does projection fidelity prove that the underlying velocity is biologically correct?
- What was observed
- The proposed test assesses an embedding relative to its high-dimensional counterpart.
- Where the conclusion stops
- The underlying model and biological interpretation require separate assessment.
Source 1 · Publisher abstract and editorial interpretation
Compare the actual experiments
These studies answer different questions. Read the unit and endpoint before comparing results.
| Study | Unit & setting | Readout | Interpretation boundary |
|---|---|---|---|
| Velocity estimate Source 1 · Publisher abstract | High-dimensional single-cell model | Estimated direction of cell-state change | Its biological assumptions are separate from projection fidelity. |
| Two-dimensional projection Source 1 · Publisher abstract | A map representing the higher-dimensional result | Visualized velocity field | Compression can affect what the visual representation preserves. |
The export includes claims, available numbers, methods and source locations. It contains our reading notes and published summaries; it is not raw participant data or an independent reanalysis.
Evidence update · 21 Nov 2026
First publication. Reported observations, arithmetic and proposed follow-up questions are separated. No raw-data reanalysis. AI source check; no human editorial or clinical review.
Three questions that can be mistaken for one
| Reading question | What the paper reports | What remains open |
|---|---|---|
| High-dimensional estimate | A model assigns an estimated direction from molecular data | Does the model capture the biological process? |
| Two-dimensional projection | An embedding turns complex data into a visible map | Which relationships were altered by compression? |
| Projection-fidelity test | The abstract says velotest compares the visualization with its high-dimensional counterpart | Agreement with a model is not direct observation of cell fate |
| Independent experiment | A separate test can challenge or support a proposed transition | Such validation details were not available in the abstract |
Original Press-News reading framework. Follow-up questions are our interpretation, not experiments performed by the authors.
Your questions, answered
Is an RNA-velocity arrow a recording of a cell moving?
No. It is a visualization of an estimated change in molecular state, not a time-lapse recording of one cell.
What did the new method assess?
The accessible abstract describes a cell-level test of whether a velocity embedding faithfully represents its high-dimensional counterpart.
Does a faithful projection prove the underlying biology?
No. The validity of the underlying velocity estimate is a separate question.
How many datasets or cells were analyzed?
The full methods and figures were not accessible for this check, so we do not report an unverified count.
Limits of this interpretation
- The accessible check was limited to the accepted-paper abstract and disclosures; methods, figures and dataset sizes were not independently reviewed.
- Projection fidelity is not a guarantee that estimated cell trajectories or biological mechanisms are correct.
- No numerical performance comparison or statistical cutoff is reported here because the necessary details were not accessible.
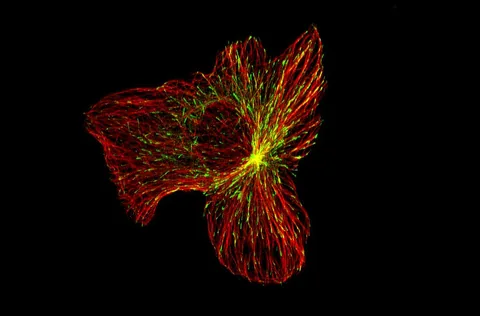
- The illustrative cell image comes from a separate project and is not an RNA-velocity figure from this study.
Sources & transparency
- Bischoff, Poličar, Mukherjee et al. (2026): velotest: statistical assessment of RNA velocity embeddings reveals quality differences for reliable trajectory visualizations
Publisher abstract, publication details and competing-interest statement only. Full accepted-manuscript methods, figures, dataset sizes and test implementation were not accessible for this check. Publisher metadata and abstract also checked. Supplements, source-data files, code and clinical records were not independently audited. No publisher figure reproduced. · Accessed 21 Nov 2026
DOI: 10.1038/s41467-026-78669-5
Prepared and source-checked with AI. Press-news Team is the collective publication byline, not a medical reviewer. No human editorial or clinical review has taken place. This educational article examines research methods and laboratory or observational findings, not individual diagnosis or treatment. We did not conduct these experiments or reanalyse raw data. Reported results, our interpretation and proposed future tests are separated. Source-access limits are recorded below. Photographs are illustrative.
Source check: AI source check — publisher abstract and competing-interest statement only
Clinical review: Not applicable to this educational guide
Suggest a correction