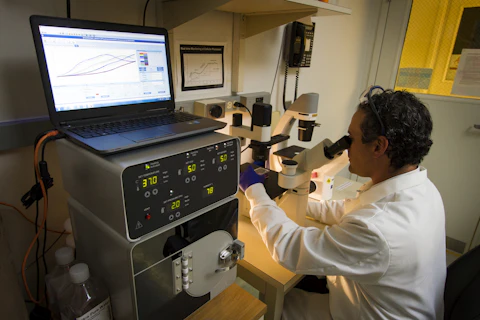
A microscopy movie is only the start of an analysis. The positions of fluorescent spots must be detected, linked into tracks and interpreted with a model.
- QuantiTrack combines tracking and multiple analyses of single-molecule motion in a MATLAB-based interface.
- In one fast-imaging comparison the paper reports 93,836 tracks from 130 cells and 108,696 tracks from 133 cells.
- Tracks from the same cell are not independent patients. Simulations and an example in cultured cells do not establish a clinical test.
- Paper date
- 16 November 2026
- Method
- Single-molecule tracking
- Example
- Cultured cells
Original publication: 16 Nov 2026 · The date above refers to this brief.
What happens between a movie and a claim
Detect
Locate fluorescent spots in each movie frame.
Link
Connect detections into candidate molecular trajectories.
Interpret
Use quality checks and models, while retaining cell-level context.
The measurement problem
Proteins move, bind and sometimes disappear from view in a crowded cell. Single-molecule microscopy records fluorescent spots over time. Software estimates their locations and links detections into trajectories; model-based analyses then summarize features such as motion and apparent binding.
Source 1 ↗A comparison with two denominators
For the fast-imaging hormone-receptor example in Figure 7, the treated condition included 93,836 tracks from 130 cells; the washout condition included 108,696 tracks from 133 cells. These are two different levels of observation. The tracks are nested within cells, and neither count is a count of patients.
Source 1 ↗Fast and slow movies answer different questions
The authors also used a slower imaging protocol for binding-duration analyses. Its Figure 8 reports 58,239 receptor tracks from 96 cells in the treated condition and 32,183 from 70 cells after washout. Those counts belong to that protocol, not to Figure 7. The paper reports lower estimated bound fraction and shorter dwell times after washout in its experimental system.
Source 1 ↗Where the uncertainty enters
Simulations illustrate that dim signal, dense labels, motion blur and tracking settings can alter which molecules are detected and how trajectories are linked. A shorter track may reflect measurement limits as well as biology. Model choice and quality control therefore matter before interpreting a difference.
Source 1 ↗From a tool to a useful result
The software brings complementary analyses into one workflow, but it does not replace independent validation or automatically make every track biologically interpretable. As with the related deep-tissue microscopy story, an advance in measurement capability is different from evidence for a clinical application.
Cells, tracks and simulated observations
Accepted primary manuscript PDF accessed through a research search interface: abstract, simulations, Figure 7–8 captions and discussion. The accepted manuscript may be edited. Publisher metadata and abstract also checked. Supplements, source-data files, code and clinical records were not independently audited. No publisher figure reproduced.
01Are all tracked trajectories independent biological samples?
- What was observed
- Figure 7 reports 93,836 tracks from 130 cells for one condition.
- Where the conclusion stops
- Tracks are nested within cells and are not patients.
Source 1 · Accepted manuscript Figure 7 caption
02Do the Figure 7 and Figure 8 counts describe the same imaging protocol?
- What was observed
- Figure 7 reports fast-imaging data; Figure 8 reports a separate slow-imaging analysis.
- Where the conclusion stops
- Each number must be interpreted with its protocol and condition.
Source 1 · Accepted manuscript Figures 7–8 captions
Numbers you can inspect
| Measure | Value & unit | Origin & method |
|---|---|---|
| Fast imaging, treated cells | 130 cells | Reported Cell count for the treated condition in Figure 7. Source 1 · Accepted manuscript Figure 7 caption |
| Fast imaging, treated tracks | 93836 tracks | Reported Tracks from those treated cells in Figure 7. Source 1 · Accepted manuscript Figure 7 caption |
| Fast imaging, washout cells | 133 cells | Reported Cell count for washout in Figure 7. Source 1 · Accepted manuscript Figure 7 caption |
| Fast imaging, washout tracks | 108696 tracks | Reported Tracks from washout cells in Figure 7. Source 1 · Accepted manuscript Figure 7 caption |
| Slow imaging, treated cells | 96 cells | Reported Cell count for treated receptor movies in Figure 8. Source 1 · Accepted manuscript Figure 8 caption |
| Slow imaging, washout cells | 70 cells | Reported Cell count for washout receptor movies in Figure 8. Source 1 · Accepted manuscript Figure 8 caption |
Compare the actual experiments
These studies answer different questions. Read the unit and endpoint before comparing results.
| Study | Unit & setting | Readout | Interpretation boundary |
|---|---|---|---|
| Simulated movies Source 1 · Accepted manuscript Figures 2–4 and discussion | Simulated fluorescent trajectories | Detection and tracking fidelity | Results apply to specified simulation settings. |
| Hormone-receptor demonstration Source 1 · Accepted manuscript Figures 7–8 | Cultured cells and nested tracks | Motion and estimated binding after treatment and washout | Not a clinical treatment assessment. |
The export includes claims, available numbers, methods and source locations. It contains our reading notes and published summaries; it is not raw participant data or an independent reanalysis.
Evidence update · 17 Nov 2026
First publication. Reported observations, arithmetic and proposed follow-up questions are separated. No raw-data reanalysis. AI source check; no human editorial or clinical review.
Four counts that should not be mixed
| Reading question | What the paper reports | What remains open |
|---|---|---|
| Fast imaging, treated | 130 cells and 93,836 tracks | Cell count and track count are different units |
| Fast imaging, washout | 133 cells and 108,696 tracks | Different condition within the Figure 7 analysis |
| Slow imaging, treated | 96 cells and 58,239 tracks | Separate Figure 8 protocol |
| Slow imaging, washout | 70 cells and 32,183 tracks | Do not add to fast-imaging counts as independent patients |
Original Press-News reading framework. Follow-up questions are our interpretation, not experiments performed by the authors.
Your questions, answered
Are 93,836 tracks 93,836 patients?
No. They are trajectories reported from 130 cells in one laboratory condition.
Is a fluorescent spot always the same molecule throughout a track?
A track is a computational assignment; missed detections and incorrect links can occur.
Does this study test a treatment in people?
No. Its example concerns a hormone receptor in a laboratory cell system.
Why compare simulations with real movies?
Simulations let the authors examine how specified imaging conditions can affect tracking, while real movies demonstrate the workflow on a biological example.
Limits of this interpretation
- Simulations reveal behavior under specified conditions, not every microscope or biological sample.
- Trajectories are nested within cells; track counts cannot be presented as patient counts or independent biological replicates.
- Fast and slow imaging produce separate datasets with different counts and purposes.
- The demonstration is a cell experiment, not an assessment of treatment in patients; the code and raw data were not independently rerun.
Sources & transparency
- Ball, Wagh, Stavreva et al. (2026): Quantitrack: a unified software to study protein dynamics in living cells
Accepted primary manuscript PDF accessed through a research search interface: abstract, simulations, Figure 7–8 captions and discussion. The accepted manuscript may be edited. Publisher metadata and abstract also checked. Supplements, source-data files, code and clinical records were not independently audited. No publisher figure reproduced. · Accessed 17 Nov 2026
DOI: 10.1038/s41598-026-78601-3
Prepared and source-checked with AI. Press-news Team is the collective publication byline, not a medical reviewer. No human editorial or clinical review has taken place. This educational article examines research methods and laboratory or observational findings, not individual diagnosis or treatment. We did not conduct these experiments or reanalyse raw data. Reported results, our interpretation and proposed future tests are separated. Source-access limits are recorded below. Photographs are illustrative.
Source check: AI source check — selected primary results, captions and study boundaries
Clinical review: Not applicable to this educational guide
Suggest a correction