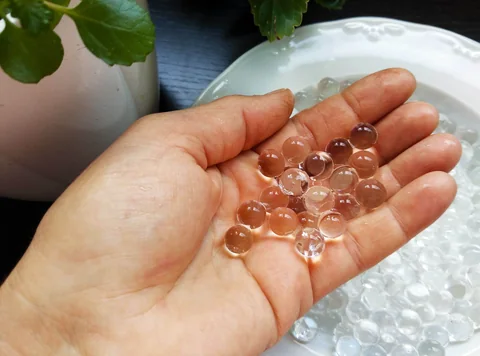
A cell has to make room for its daughter. In a transparent three-dimensional growth material, researchers can watch that physical requirement become a constraint. The result offers a way to study a changed behaviour that a bulk molecular snapshot may only weakly register.
- The physical setting is part of an experimental model.
- Yield stress is a material property, not a rate of cell division.
- A bulk measurement at one time cannot exclude every transient response.
- Paper date
- 16 October 2026
- Organism
- Budding yeast; Saccharomyces cerevisiae
- Material
- Transparent, mechanically tunable 3D microgel matrix
Original publication: 16 Oct 2026 · The date above refers to this brief.
A contrast in the material, not an effect-size estimate
approximate matrix yield stress in pascals (Pa)
Read behaviour beside the sampling window
Observe
Track the physical phenotype over time.
Sample
State when and where molecular data were collected.
Challenge
Test whether another time or location changes the explanation.
What changes when cells must push against a matrix
Sreepadmanabh and colleagues grow budding yeast in tunable transparent materials. Greater confinement prolongs intervals between buds; cells moved back into liquid revert to faster budding. The authors connect the delay to restricted bud growth during G2. Bulk RNA and protein comparisons show little matching change between low and high confinement, with caveats about timing and population averaging.
Source 1 ↗Keep two meanings of resistance apart
Our chart shows the reported yield stresses of the low- and high-confinement matrices:approximately 3 and 60 pascals. Their ratio is20, but that is our arithmetic for a material property, not a twenty-fold slowing of cell division. A rate claim would need its own measured timing and denominator.
Source 1 ↗Why the liquid control is not the only comparison
Our reading note keeps both liquid-to-matrix and low-to-high matrix comparisons. They ask different questions:entering a three-dimensional environment changes more than increasing resistance within one. If a molecular signature appears in the first comparison but not the second, it should not be assigned to the second automatically.
This is a useful general lesson for model design. Change one physical feature where possible, record the other features, and test whether moving a cell out of the condition reverses the phenotype. Reversibility narrows an explanation without proving every alternative has been excluded.
A molecular non-finding still has a sampling window
The molecular profiling uses a24-hour time point. An average at that time cannot exclude an earlier transient event or a change confined to a small subpopulation. The authors explicitly discuss these boundaries.
Source 1 ↗The next experiment suggested by the gap
Our proposed follow-up would align imaging with earlier and later molecular measurements, keeping individual colonies or locations identifiable. That could distinguish a direct physical delay from a brief response that disappears before bulk sampling. It would also expose differences between a colony edge and its interior.
This is a proposed research direction, not a reanalysis we have performed. Absence of a detected large programme is useful evidence when the assay, time and comparison are stated. It should not become proof that every signalling process was inactive.
Why it belongs beside immune-cell research
The viscosity study in this collection alters a fluid setting around human immune cells; this study alters a yield-stress matrix around yeast. The common question concerns context, the outcomes and materials differ. Combining their numerical effects would have no defined meaning.
Together they suggest a practical habit:write down the physical environment before deciding which molecular explanation a model supports. Future work could make laboratory models more informative by measuring their mechanics alongside their biology. The yeast result does not establish how a human tissue or tumour would respond.
Physical contrast and molecular sampling window
Selected final primary PDF: material properties and growth Results, Figs.1–2; bulk molecular profiling and caveats, Fig. 3; cell-cycle Results, Fig.4. Figure 2 caption visually inspected. No supplementary or raw-data reanalysis. Publisher HTML metadata and abstract also checked. Supplements, source-data files, code and clinical records were not audited. No publisher figure reproduced.
01What changed?
- What was observed
- Budding slows under greater confinement and speeds up after transfer to liquid.
- Where the conclusion stops
- A yeast culture phenotype, not a measured human tissue response.
Source 1 · Primary PDF Fig. 2 and corresponding Results
02What does a quiet bulk profile mean?
- What was observed
- Limited molecular differences at the sampled24-hour time point.
- Where the conclusion stops
- Early/transient or subpopulation effects are not excluded.
Source 1 · Primary PDF molecular profiling Results and caveats; Fig. 3
Numbers you can inspect
| Measure | Value & unit | Origin & method |
|---|---|---|
| Low-confinement yield stress | 3 Pa | Reported Approximate reported material setting. Source 1 · Primary PDF initial growth Results; Fig. 1 |
| High-confinement yield stress | 60 Pa | Reported Approximate material setting; not cellular pressure. Source 1 · Primary PDF initial growth Results; Fig. 1 |
| High-to-low yield-stress ratio | 20 fold | Calculated 60 /3; approximate material ratio, not a division-rate effect. Source 1 · Reported material settings; Press-News arithmetic |
| Molecular profiling time point | 24 hours | Reported A sampling window, not proof that no earlier response occurred. Source 1 · Primary PDF molecular profiling caveats |
| Liquid budding events in Fig. 2b | 116 events | Reported Individual events; not 116 independent human subjects. Source 1 · Primary PDF Fig. 2b caption |
| Low-confinement budding events in Fig. 2b | 121 events | Reported Individual-event count. Source 1 · Primary PDF Fig. 2b caption |
| High-confinement budding events in Fig. 2b | 88 events | Reported Individual-event count. Source 1 · Primary PDF Fig. 2b caption |
Compare the actual experiments
These studies answer different questions. Read the unit and endpoint before comparing results.
| Study | Unit & setting | Readout | Interpretation boundary |
|---|---|---|---|
| Time-lapse and transfer Source 1 · Primary PDF Fig. 2 | Yeast in matrix and liquid | Budding intervals | Reversibility constrains explanations without proving all mechanisms. |
| Bulk molecular profiling Source 1 · Primary PDF Fig. 3 and caveats | Population samples at 24 hours | RNA and protein differences | Snapshot and averaging limitations remain. |
The export includes claims, available numbers, methods and source locations. It contains our reading notes and published summaries; it is not raw participant data or an independent reanalysis.
Evidence update · 19 Oct 2026
First publication. Reported observations, our calculations and proposed follow-up questions are distinguished. No raw data reanalysis. AI source check; no human editorial or clinical review.
The comparison determines the question
| Observation | Keep beside it | Next useful question |
|---|---|---|
| Liquid versus 3D matrix | Multiple environmental changes | Which feature explains the phenotype? |
| Low versus high confinement | Material properties with units | Does the difference track the physical constraint? |
| Transfer back to liquid | Behaviour after removal | Is the delay reversible? |
| Bulk RNA at 24 hours | Time and population average | Could an earlier or local response be missed? |
Original Press-News comparison framework. Proposed checks are our interpretation, not additional experiments reported by the authors.
Your questions, answered
Are 3 and 60 Pa cell-division speeds?
No. They are approximate yield stresses of the growth materials.
Does20-fold describe the biological effect?
No. It is only60 divided by 3 for the reported material settings.
Does little bulk RNA change mean nothing happened?
No. Behaviour changed; the assay still has time and averaging limits.
Can this predict human tumour growth?
Not from this experiment alone. A human system would require its own model and tests.
Limits of this interpretation
- Yeast in a synthetic matrix are not a human tissue model by themselves.
- Material yield stress and cell-cycle timing have different units.
- Bulk 24-hour profiles can miss transient or minority-cell responses.
- No raw time-lapse measurements or supplementary datasets were independently reanalysed.
Sources & transparency
- Sreepadmanabh, Gautam, Bagade et al. (2026): 3D confinement physically regulates cell cycle progression in budding yeast
Selected final primary PDF: material properties and growth Results,Figs.1–2; bulk molecular profiling and caveats,Fig. 3; cell-cycle Results,Fig.4. Figure 2 caption visually inspected. No supplementary or raw-data reanalysis. Publisher HTML metadata and abstract also checked. Supplements, source-data files, code and clinical records were not audited. No publisher figure reproduced. · Accessed 19 Oct 2026
DOI: 10.1038/s41467-026-78414-y
Prepared and source-checked with AI. Press-news Team is a collective publication byline, not a medical reviewer. No human editorial or clinical review has taken place. This educational explainer examines experimental methods and basic or preclinical research; it does not provide individual diagnosis or treatment advice. We did not conduct these experiments or reanalyse raw data. Findings, interpretation and proposed future tests are separated. Source-access limits are recorded below. Photographs are illustrative.
Source check: AI source check — selected primary PDF results, captions and experimental boundaries
Clinical review: Not applicable to this educational guide
Suggest a correction