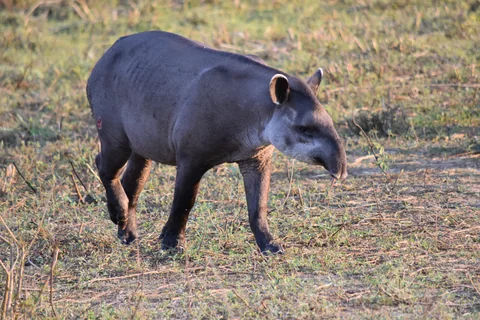
A particle count can reveal an exposure without showing where every particle came from or what it did to an animal. A study of wild mammals illustrates the distinction.
- The researchers collected blood from 26 lowland tapirs and 21 giant anteaters in Brazil.
- Plastic particles were detected in 43 of the 47 animals; 40 had enough movement data for the habitat analysis.
- The observed associations do not establish an individual particle’s source or a health effect.
- Paper date
- 11 November 2026
- Blood samples
- 47 wild animals
- Movement analysis
- 40 animals
Original publication: 11 Nov 2026 · The date above refers to this brief.
Blood samples and the tracking subset
animals
From animal sample to landscape association
Measure
Identify particles in blood from the selected animals.
Locate
Use available movement records to describe their home ranges.
Interpret
Compare measures while retaining uncertainty about sources and effects.
What did the researchers measure?
The team collected blood and movement data from wild lowland tapirs and giant anteaters across three Brazilian regions between 2021 and 2022. They used a spectroscopic method to identify particles larger than one micrometre in the blood samples. The animals and regions were selected for this study, not randomly sampled from all wildlife.
Source 1 ↗A denominator for each question
Blood was collected from 47 animals: 26 tapirs and 21 anteaters. The authors report no detected plastic in four animals, so 43 had a detection. Our calculation is 43 ÷ 47, or about 91.5% in this sample. The landscape comparison used 40 animals with sufficient tracking data. It is not correct to treat all 47 as part of that analysis.
Source 1 ↗Detection is not a health diagnosis
Across samples, 2,815 of 17,165 particles meeting the reported spectral-quality criterion were identified as microplastic. Those are particles, not animals or cases of illness. Concentrations varied considerably between animals. A detection does not by itself show a clinical effect, and a non-detection does not prove that no smaller particles were present.
Source 1 ↗What the location comparison showed
The authors found an association between blood concentrations and the maximum human-footprint score within an animal’s home range; an analysis using the weighted mean footprint was not statistically significant. Maximum and mean exposure are different summaries. The study’s observational design cannot prove a specific source, route or cause of a particular animal’s particle burden.
Source 1 ↗What would make the next study stronger?
The paper notes that matching environmental samples with blood samples could help investigate sources. Larger studies spanning more species and locations could also test whether the association is reproducible and whether any measured particle burden relates to independent health outcomes. Those are future questions, not results established here.
Source 1 ↗How this connects to a laboratory study
A separate study in our collection used human-derived cells, lung slices and mice to examine responses to manufactured polystyrene particles. That work tests laboratory responses; this wildlife study measures detections and environmental associations. Neither directly demonstrates that the measured blood particles caused the effects observed in the other experiment.
Forty-seven samples are not forty-seven tracked animals
Primary PDF: abstract, Results and Fig. 1 on pp. 1–2, and Fig. 2 on habitat analysis. The Fig. 1 and Results page was visually inspected. Publisher metadata and abstract also checked. Supplements, source-data files, code and clinical records were not independently audited. No publisher figure reproduced.
01How many animals had a reported detection?
- What was observed
- The authors found no detected plastic in four of 47 animals, leaving 43 with a detection.
- Where the conclusion stops
- The selected sample does not estimate population-wide prevalence or disease.
Source 1 · Primary PDF Results p. 2
02Did every habitat measure show the same relationship?
- What was observed
- The maximum footprint in the home range was associated with concentration; the weighted mean footprint was not statistically significant.
- Where the conclusion stops
- These observational measures do not establish a causal source or health outcome.
Source 1 · Primary PDF Results and Fig. 2
Numbers you can inspect
| Measure | Value & unit | Origin & method |
|---|---|---|
| Tapirs with blood samples | 26 animals | Reported Lowland tapirs in the sampled group. Source 1 · Primary PDF Fig. 1 p. 2 |
| Anteaters with blood samples | 21 animals | Reported Giant anteaters in the sampled group. Source 1 · Primary PDF Fig. 1 p. 2 |
| Animals with blood samples | 47 animals | Reported Total sampled animals. Source 1 · Primary PDF Results p. 2 |
| Animals with sufficient tracking | 40 animals | Reported Subset of the 47 blood-sampled animals. Source 1 · Primary PDF Results p. 2 |
| Animals with a detection | 43 animals | Calculated 47 minus four animals without a detection. Source 1 · Primary PDF Results p. 2 |
| Detected fraction of this sample | 91.5 percent | Calculated 43 divided by 47, rounded to one decimal place; not population prevalence. Source 1 · Primary PDF Results p. 2 |
Compare the actual experiments
These studies answer different questions. Read the unit and endpoint before comparing results.
| Study | Unit & setting | Readout | Interpretation boundary |
|---|---|---|---|
| Blood particle survey Source 1 · Primary PDF Results p. 2 | 47 selected animals | Detected particles larger than the reported threshold | Detection is not a clinical diagnosis. |
| Habitat association Source 1 · Primary PDF Results and Fig. 2 | 40 animals with sufficient tracking | Maximum and weighted mean footprint summaries | Different summaries need not yield the same statistical result. |
The export includes claims, available numbers, methods and source locations. It contains our reading notes and published summaries; it is not raw participant data or an independent reanalysis.
Evidence update · 13 Nov 2026
First publication. Reported observations, arithmetic and proposed follow-up questions are separated. No raw-data reanalysis. AI source check; no human editorial or clinical review.
Keep the units and questions separate
| Reading question | What the paper reports | What remains open |
|---|---|---|
| Blood samples | 47 animals: 26 tapirs and 21 anteaters | The sample is not all wildlife |
| Detections | 43 of 47 animals had a reported detection | Detection does not establish disease |
| Habitat analysis | 40 animals had sufficient tracking data | The analysis uses a subset of the blood samples |
| Particles identified | 2,815 of 17,165 qualified particles were plastic | Particles are not animals or diagnoses |
Original Press-News reading framework. Follow-up questions are our interpretation, not experiments performed by the authors.
Your questions, answered
Were all 47 animals included in the movement analysis?
No. The paper reports sufficient tracking data for 40 animals.
Did every animal have a detected particle?
No. Four did not; the remaining 43 had a detection in the reported sample.
Does detection mean that an animal was ill?
No. The particle measurement alone does not establish a health outcome.
Were nanoplastics ruled out in animals without a detection?
No. The reported method detected particles larger than one micrometre, so a non-detection does not exclude smaller particles.
Limits of this interpretation
- The 47 selected animals do not provide a representative prevalence estimate for all wildlife or people.
- Only 40 animals had sufficient movement data for the landscape analysis.
- The method reported detection of particles larger than one micrometre; non-detection does not exclude smaller particles.
- Associations cannot identify the source of every particle or prove health effects.
Sources & transparency
- de Almeida Monteiro Melo Ferraz, Desbiez, Alves et al. (2026): Human land use drives microplastic abundance in terrestrial wildlife
Primary PDF: abstract, Results and Fig. 1 on pp. 1–2, and Fig. 2 on habitat analysis. The Fig. 1 and Results page was visually inspected. Publisher metadata and abstract also checked. Supplements, source-data files, code and clinical records were not independently audited. No publisher figure reproduced. · Accessed 13 Nov 2026
DOI: 10.1038/s41586-026-11285-x
Prepared and source-checked with AI. Press-news Team is the collective publication byline, not a medical reviewer. No human editorial or clinical review has taken place. This educational article examines research methods and laboratory or observational findings, not individual diagnosis or treatment. We did not conduct these experiments or reanalyse raw data. Reported results, our interpretation and proposed future tests are separated. Source-access limits are recorded below. Photographs are illustrative.
Source check: AI source check — selected primary PDF results, captions and study boundaries
Clinical review: Not applicable to this educational guide
Suggest a correction